PET Bottles

China PET Cup Manufacturer | Quality China PET Cup Supplier

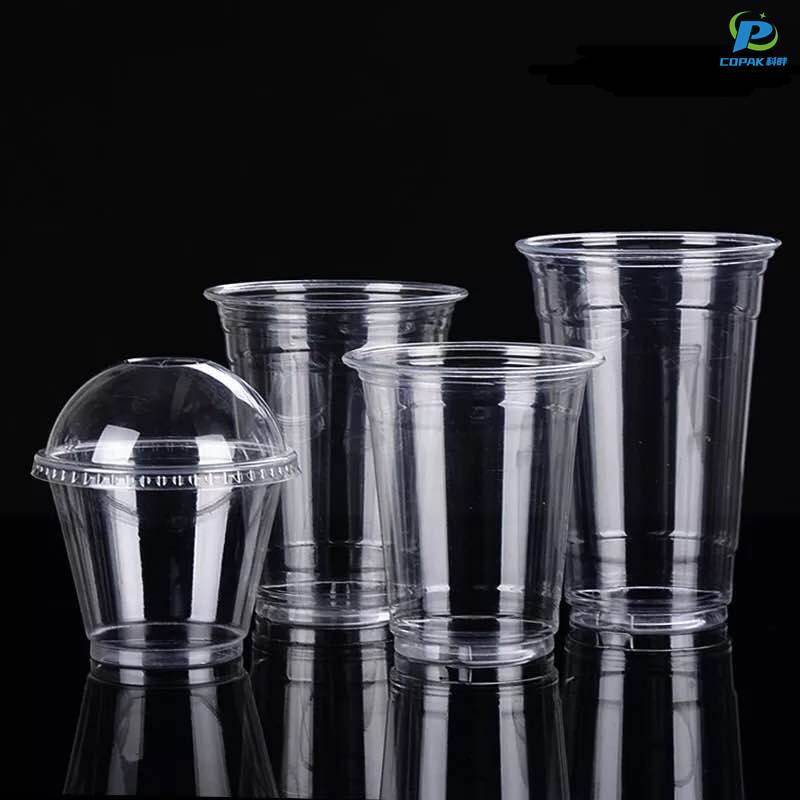
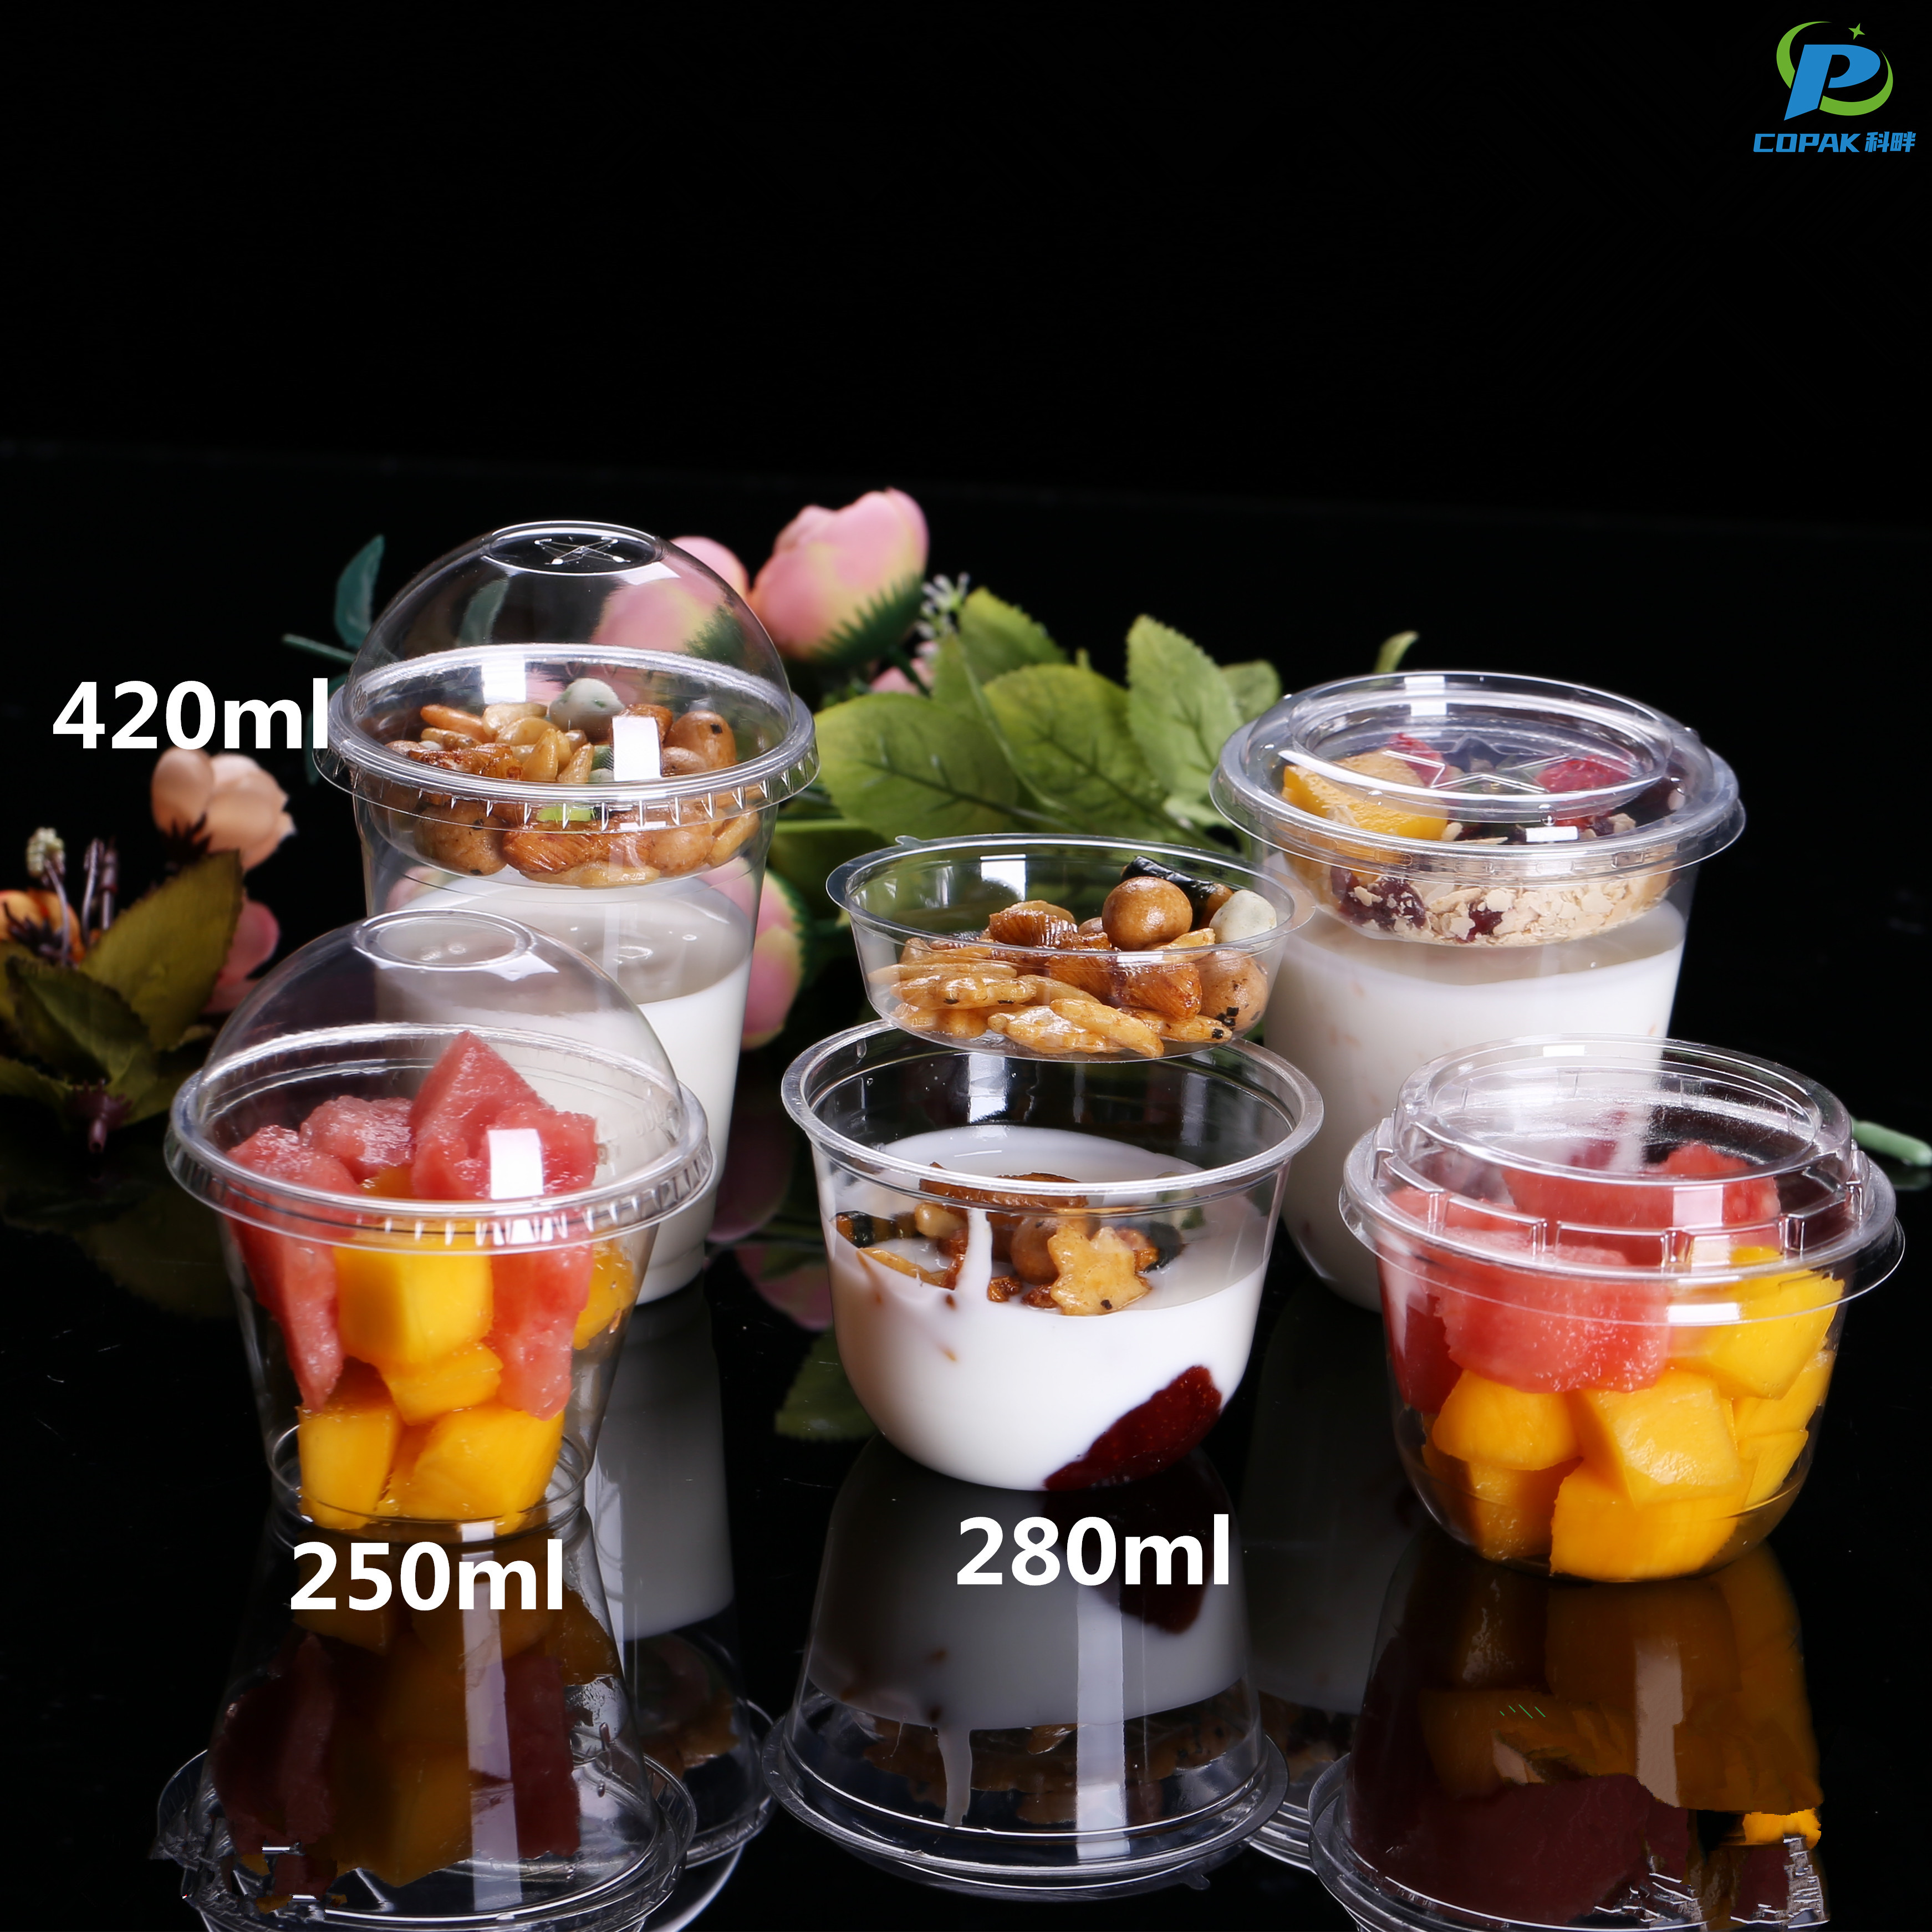
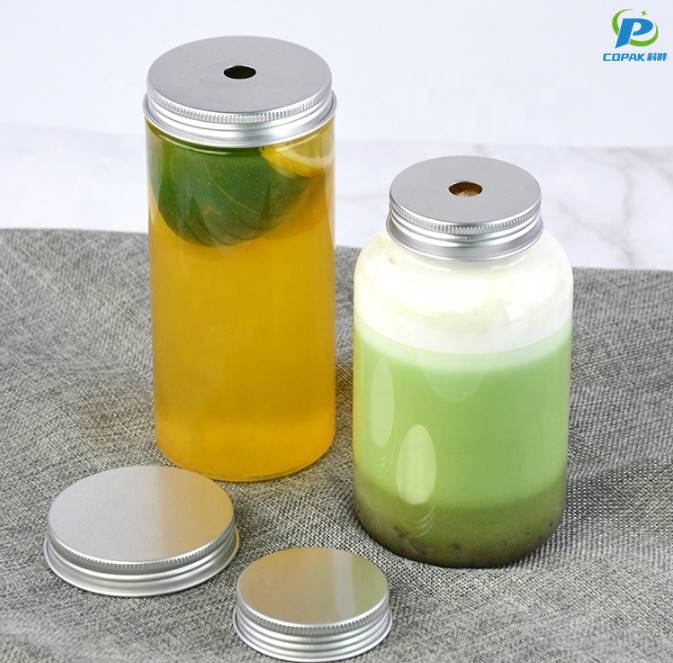
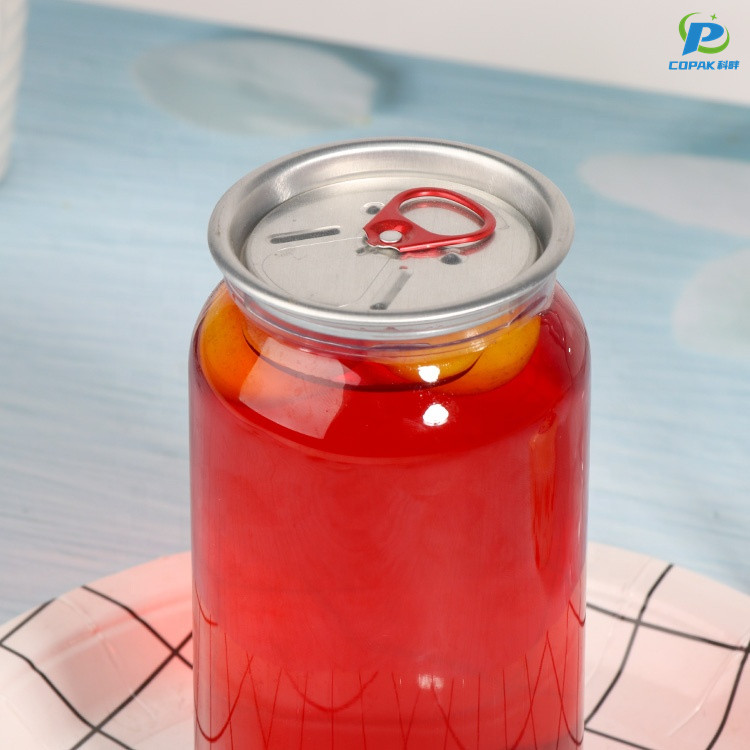
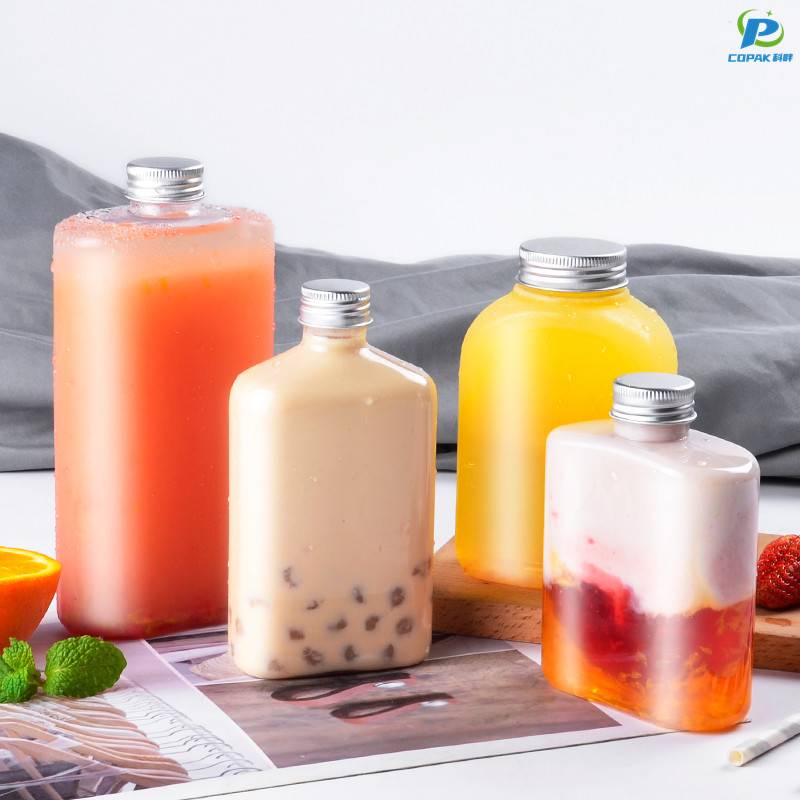
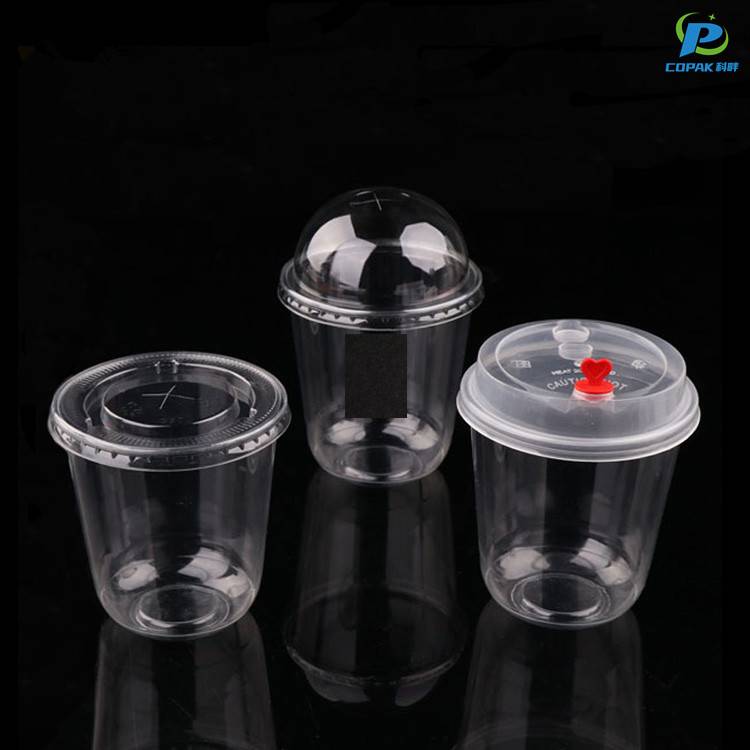
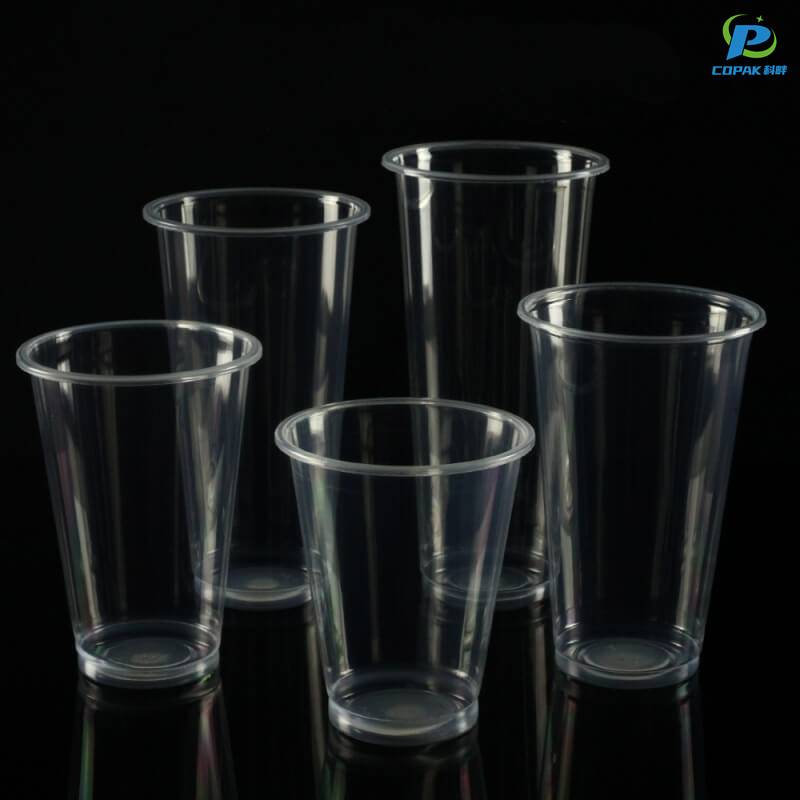
From a China-based Manufacturer, I offer the China PET Cup that fits modern food packaging demands. Our China PET Cup is clear, sturdy, and BPA-free, ideal for cold drinks, yogurt parfaits, and take-away desserts. I supply them in standard sizes and can customize printing, colors, and volume. As a buyer I know you look for cost efficiency, reliable supply, and fast lead times; I deliver with strict QC and ISO guidelines. The cups are recyclable and comply with food contact regulations, safe for hot or cold beverages depending on lid compatibility. My factory produces with precision, offering competitive pricing and low MOQ for new customers. If you want to scale, I can arrange drop-shipping to your distribution center. By choosing me as your China-based Manufacturer, you gain a partner who understands your market and can provide consistent supply of high-quality China PET Cup.

Hot Selling Product

China PET Cup Factory More Than a Supplier - A Partner

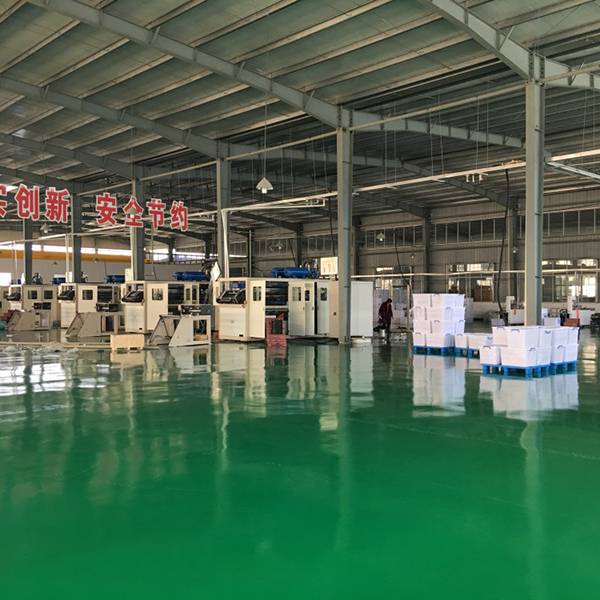
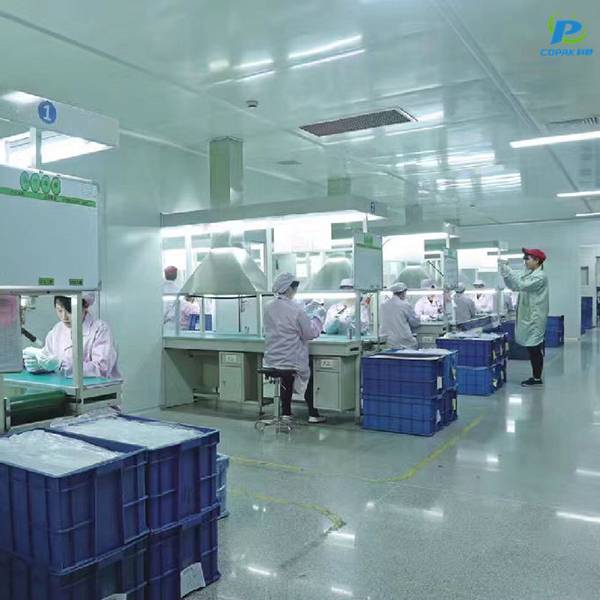
A China PET cup factory based in the Shanghai region can be far more than a supplier — it can be a strategic partner that solves production, quality and logistics challenges for global buyers. With modern production lines, strict food-safety certifications, sustainable material options and a seasoned quality-control system, such a partner delivers consistent, compliant products while helping reduce lead times and waste. Beyond manufacturing, this partner offers tailored design support, rapid prototyping, scalable OEM/ODM runs and competitive pricing tied to efficient supply-chain management. Multilingual customer service, flexible MOQ arrangements and coordinated export logistics ensure smooth global delivery, enabling buyers to focus on growth while relying on a trusted manufacturing ally.

{ China PET Cup Factory More Than a Supplier - A Partner}
Product Type Material Typical Capacity (ml) Wall Thickness (mm) Color Options Recyclability Manufacturing Method Typical Applications Certifications Lead Time (weeks)
Clear Single-Wall Cup PET 250 0.25 Clear, Frosted Widely recyclable (PET #1) Injection stretch blow molding Cold beverages, sampling FDA food contact; EU (Reg. 10/2011) 2–3
Stackable Cold Cup rPET (post-consumer) 350 0.30 Clear, Light Tints, Opaque White Designed for closed-loop recycling ISBM with nesting feature Chain cafes, events ISO 9001; Food contact compliance 3–4
Deli Container (with lid) PETG blend 500 0.35 Clear, Translucent Colors Recyclable where facilities exist Thermoforming with lid sealing Salads, prepared foods, catering Food contact approvals; BPA-free 3–5
Large Salad Bowl PET (thick wall) 750 0.45 Clear, Matte Finish Recyclable (design for disassembly) ISBM with reinforced rim Prepared meals, retail salads EU & FDA food contact; ISO 9001 4–6
Cold Drink Cup with Dome Lid PET / PCR blend 473 0.28 Clear, Tinted, Custom Prints PCR content improves lifecycle impact ISBM with overmolded rim Iced drinks, smoothies Food contact compliance; quality audits 2–4
Custom-Profile Specialty Cup rPET / PET blends 150–1000 0.20–0.60 Clear, Frosted, Custom Colors Tailored for recyclability or PCR content ISBM / Thermoforming / Extrusion-blow Promotional packaging, private label ISO 9001; food safety audits; traceability records 4–8
Quality Control Tests: visual inspection, dimensional verification, leak & seal tests, burst pressure, drop resistance, and thermal tolerance checks. Data above reflect typical ranges for common PET cup categories.

Related Products

Eco Friendly Products

China PET Cup Exceeds Industry Benchmarks Outperforms the Competition

PET Cup Segment: Market Penetration vs Industry Benchmarks (2019–2025)

The chart above illustrates market penetration trends for a leading PET cup segment compared to the broader industry average and the nearest competitor from 2019 through 2025. Over this seven-year window, the segment demonstrates a steady and accelerating adoption curve, rising from approximately 8% penetration in 2019 to 48% by 2025. By contrast, the industry average climbs from about 6% to 33% over the same period, while the nearest competitor progresses from roughly 7% to 35%. The divergence begins modestly in the early years but becomes more pronounced from 2021 onward, indicating that the segment’s initiatives—such as improved material performance, cost optimization, or distribution expansion—are contributing to above-market gains. The chart highlights three key insights: (1) consistent outperformance relative to the industry average, suggesting a sustainable competitive advantage rather than a temporary spike; (2) a widening gap versus the nearest competitor after 2021, which signals effective differentiation or faster scale-up; and (3) compounding year-over-year growth, with the segment’s average annual increase exceeding that of the industry benchmark. For decision-makers, these dynamics imply favorable conditions for continued investment in capacity, supply chain resilience, and targeted marketing to cement leadership. Risk factors to monitor include raw material price volatility and potential regulatory shifts affecting single-use packaging. Overall, the visualization underscores robust segment momentum and substantiates claims of outperforming industry benchmarks between 2019 and 2025, offering a quantitative foundation for strategic planning and investor communication.

Top Selling Products

Subscribe To Our Newsletter

For inquiries about our products or pricelist, please leave your email to us and we will be in touch within 24 hours.

Follow Us

on our social media
  • whatsapp (1)
  • instagram
  • youtube