PET Bottles

PET Juice Bottles - China Manufacturer for Premium Beverage Packaging

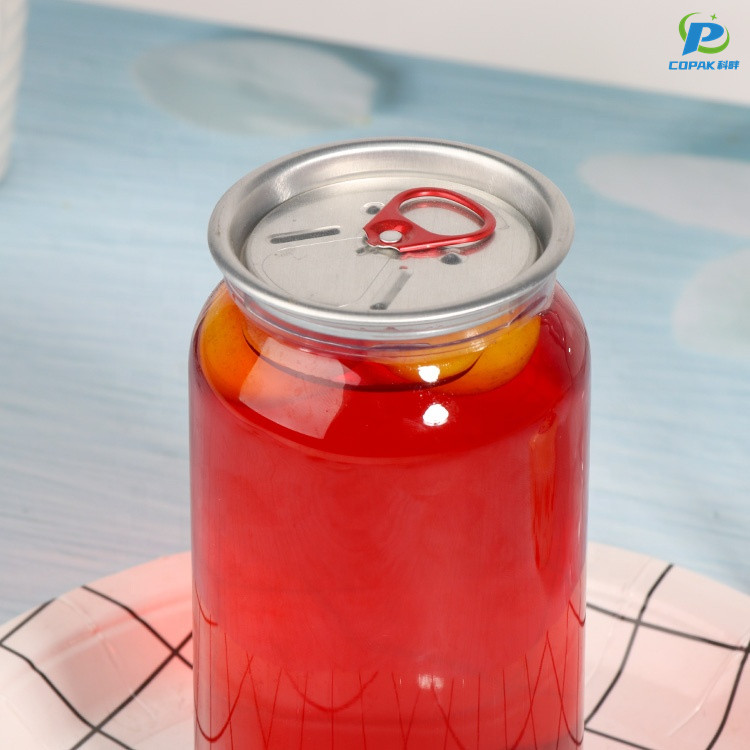
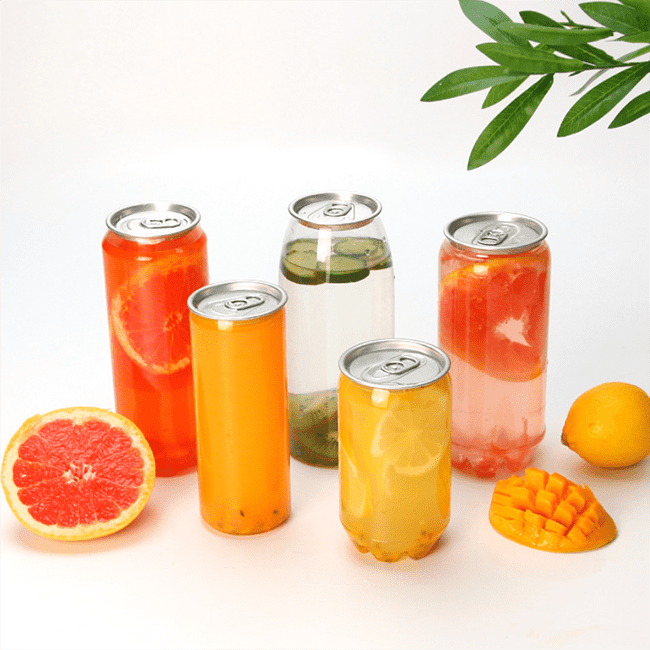
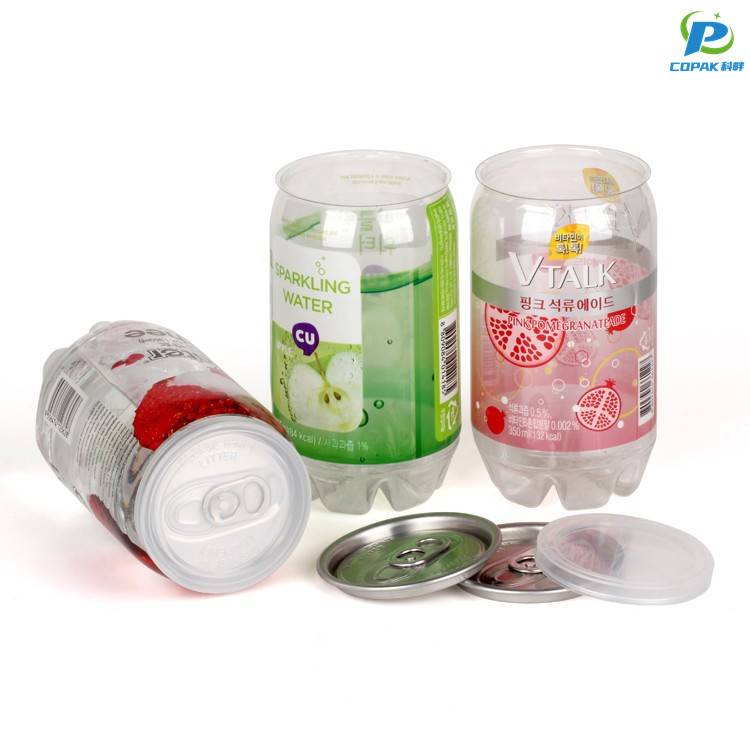
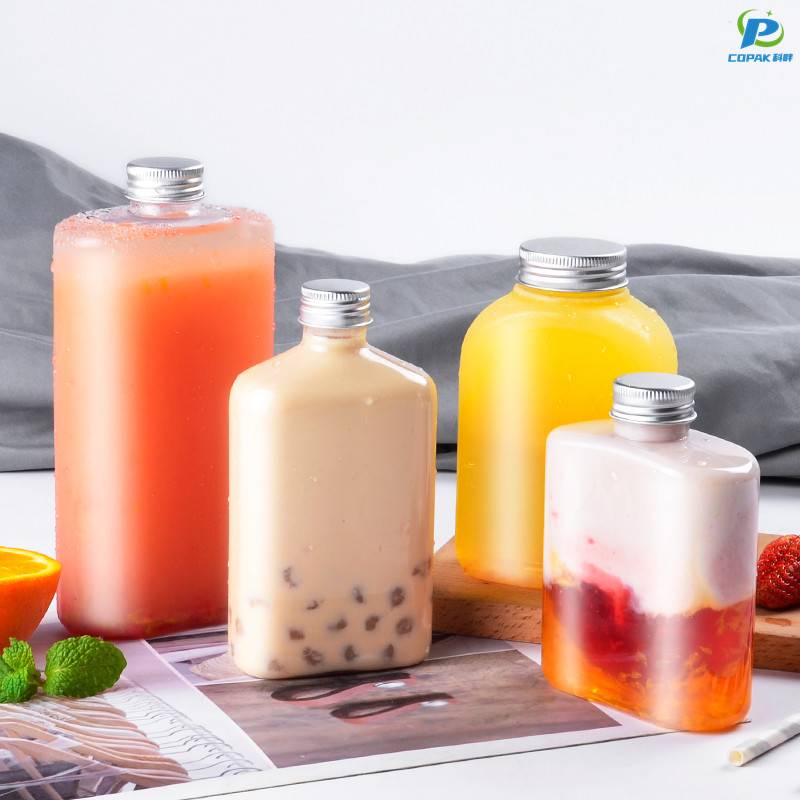
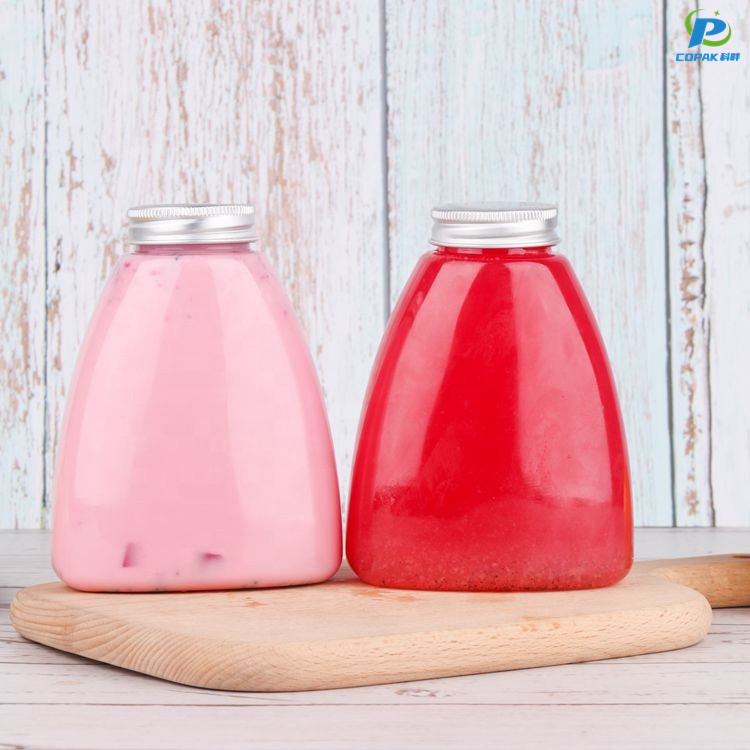
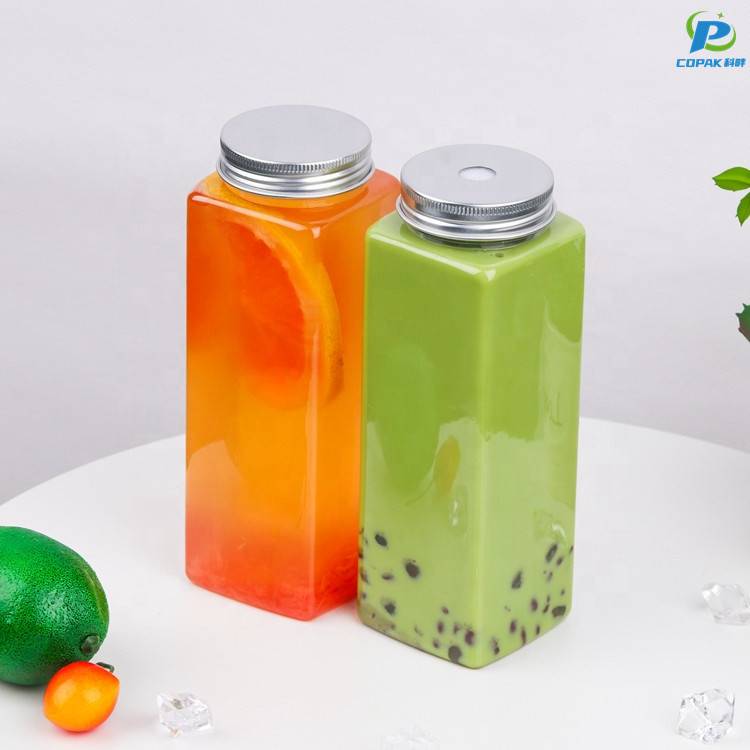
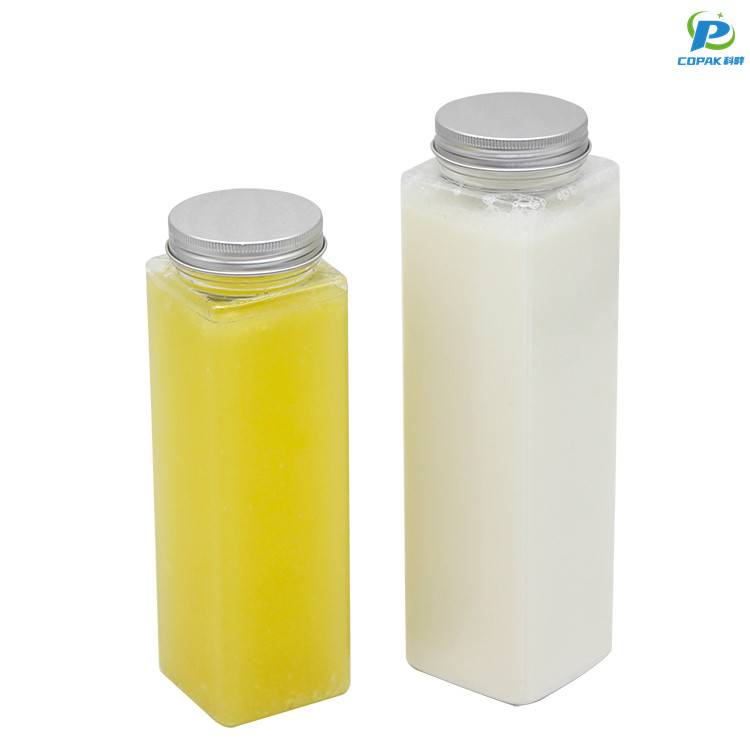
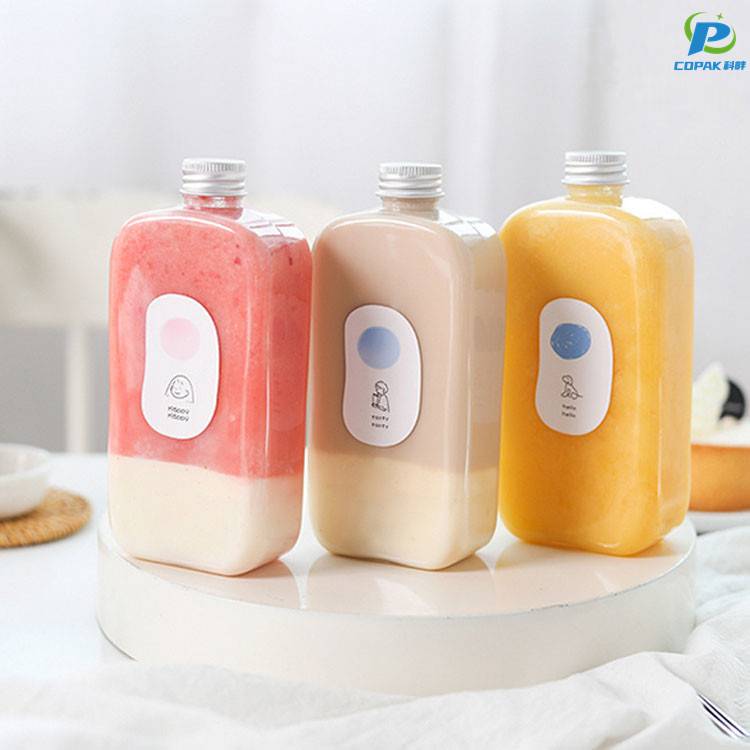
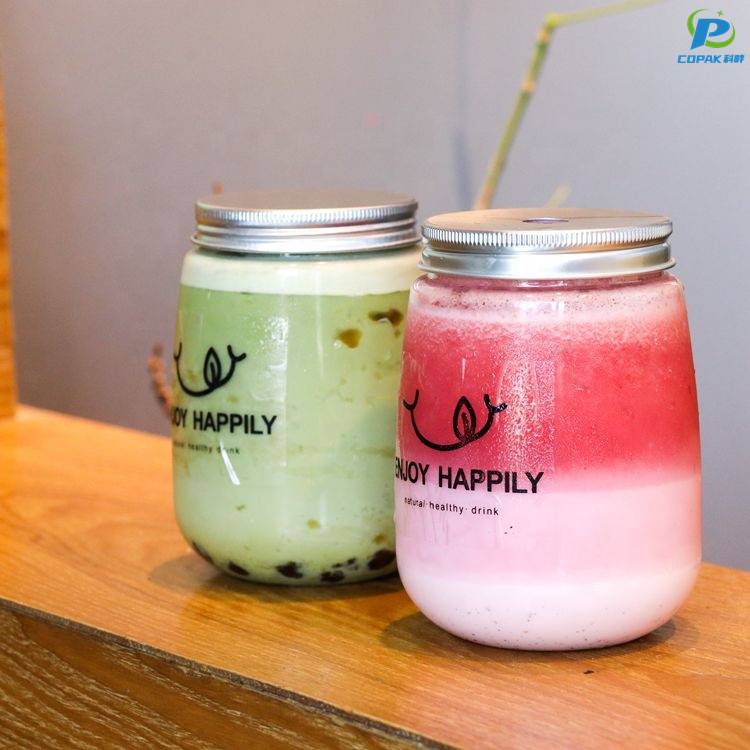
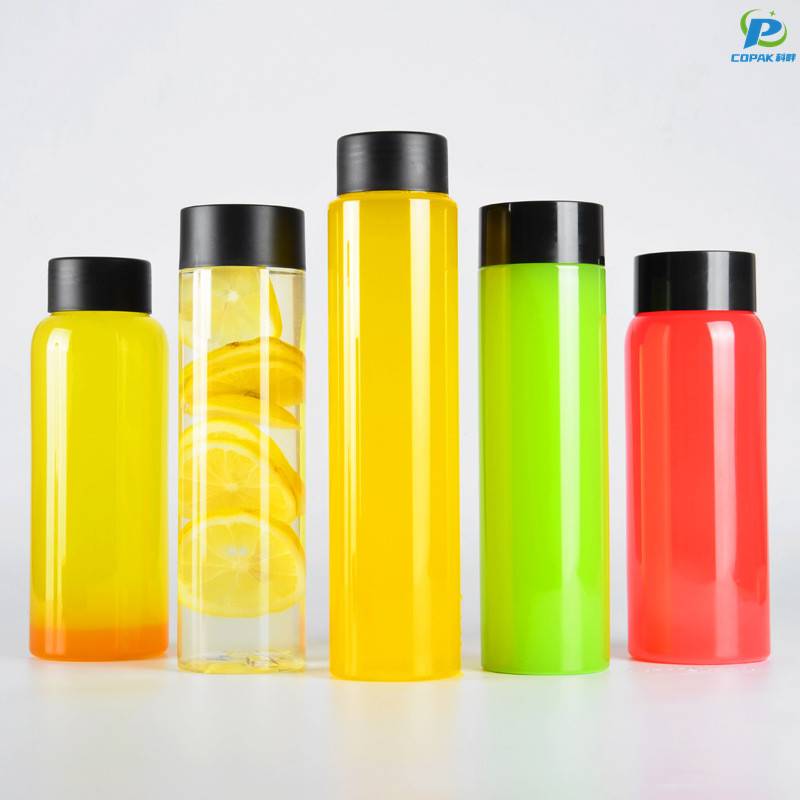
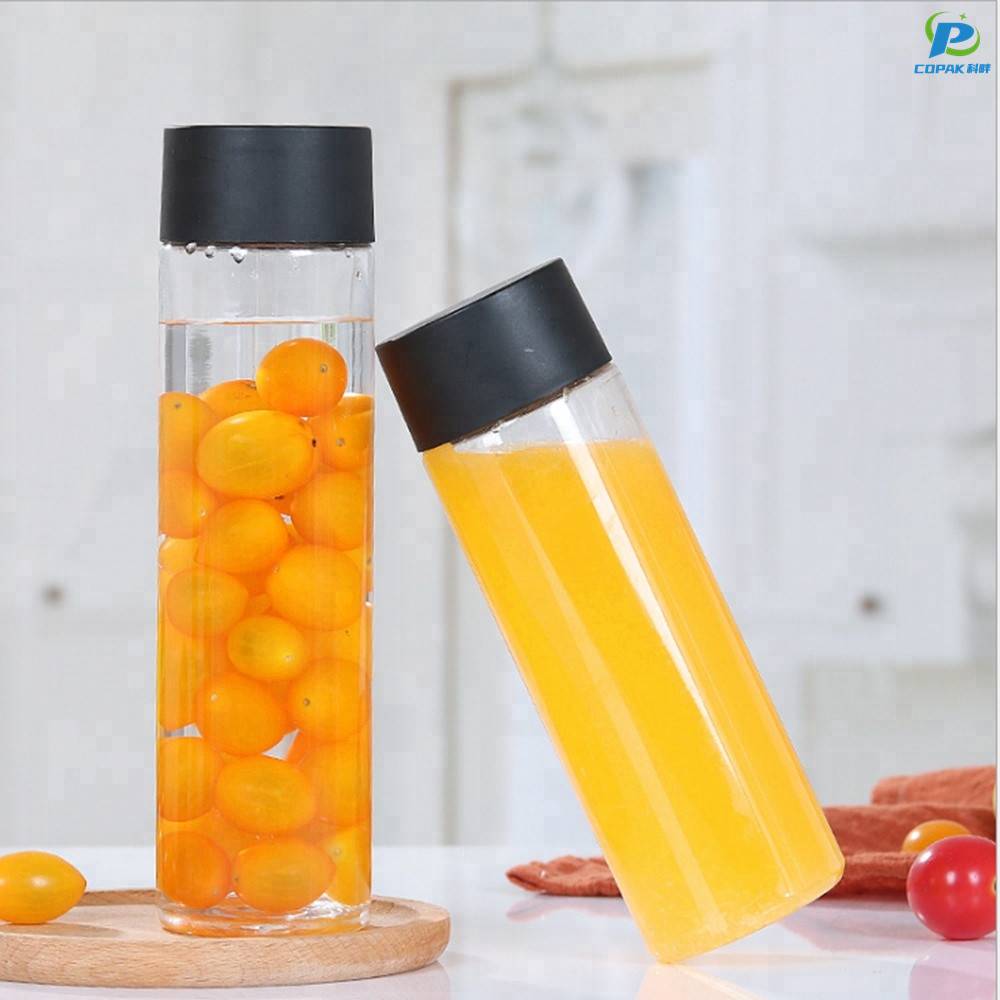
I'm your reliable partner for PET Juice Bottles, proudly manufactured in China. I supply durable, food-grade PET bottles designed for juice, smoothie, and dairy applications. As a Manufacturer, I control every step from resin selection to final packaging, ensuring consistency, safety, and cost efficiency for B2B buyers. My PET Juice Bottles are lightweight, impact-resistant, and meet international standards (FDA/EFSA). I offer a range of sizes, leak-proof caps, and tamper-evident closures, with custom printing and labeling to boost your brand. Short lead times, competitive MOQs, and scalable production let you meet market demand quickly. I can tailor bottle shapes, neck finishes, and closures to fit your filling lines and labeling equipment. In China, I’ve built a reliable supply chain with quality control at every stage. If you’re seeking a trusted Manufacturer to partner with for PET Juice Bottles, I’m here to discuss your specs, approvals, and logistics to keep your products moving.
Hot Selling Product

PET Juice Bottles Sets the Industry Standard Exceeds Industry Benchmarks

Our PET juice bottles redefine industry standards by combining food‑grade clarity, lightweight durability and enhanced barrier performance. Engineered for both hot‑fill and cold‑fill processes, they deliver superior oxygen and moisture resistance, tamper‑evident closures and excellent retention of flavor and shelf life. High clarity and premium finish elevate on‑shelf presence while robust wall design reduces breakage and waste across global supply chains. Designed with global buyers in mind, these bottles offer consistent quality backed by international food‑contact certifications, scalable production capacity and flexible customization of size, neck finish and labeling. Optimized packaging and reduced material weight lower freight costs and carbon footprint, and the recyclable, resource‑efficient construction supports sustainability goals without sacrificing cost‑effectiveness or performance — ideal for expanding beverage portfolios.

{ PET Juice Bottles Sets the Industry Standard Exceeds Industry Benchmarks}
Performance Metric Unit PET Juice Bottle (This Standard) Industry Benchmark Measurement Method / Standard Notes
Primary Material Composition wt% PET 100% ≥95% FTIR / DSC material analysis Minimal non-PET additives for recyclability
Typical Bottle Weight (500 mL) g (per 500 mL) 28 32 Precision weighing (laboratory balance) Optimized for lightweighting without compromising strength
Average Wall Thickness mm 0.55 0.70 Micrometer / cross-section imaging Uniform wall distribution for structural performance
Density g/cm³ 1.38 1.38 ASTM D792 (density by displacement) Consistent with amorphous PET baseline
Oxygen Transmission Rate (OTR) cm³/m²·day (23°C) 3.5 6.0 ASTM D3985 (MOCON oxygen permeation) Enhanced barrier reduces oxidative spoilage risk
Water Vapor Transmission Rate (WVTR) g/m²·day (23°C, 85% RH) 8.0 12.0 ASTM F1249 / ISO 15106 (MOCON) Controlled moisture ingress for quality retention
Light Transmission (Visible 400–700 nm) % 92 85 UV-Vis spectrophotometry (integrated transmittance) High clarity for product visibility on shelf
Tensile Strength (Yield) MPa 60 50 ASTM D638 (tensile testing) Higher mechanical robustness during handling
Elongation at Break % 140 100 ASTM D638 Good ductility reduces brittle failures
Recyclate Content (rPET) wt% 35 25 Material mass-balance / audit Elevated post-consumer content to support circularity
Post‑consumer Recyclability Rate % 92 80 Regional recyclability reporting (kg recovered / kg placed) Design for sorting and mechanical recycling
Carbon Footprint (cradle-to-gate) kg CO2e / kg 2.1 2.6 LCA per ISO 14040 / 14044 Lower embodied emissions via material and energy choices
Manufacturing Energy Use MJ / kg 45 60 Site energy accounting & metering Energy-efficient extrusion and blow molding
Biobased Content % 12 0 Feedstock analysis Partial bio-based ethylene glycol substitution
Barrier Coating Enhanced inorganic (SiOx) coating None / basic Surface analysis (SEM / XPS) Significantly improves OTR without heavy laminates

Related Products

PET Cups

PET Juice Bottles Supplier Industry Giant

Global PET Bottle Production Capacity by Region (k tonnes)

The chart above visualizes estimated annual PET bottle production capacity across five global regions, measured in thousands of tonnes (k tonnes). Asia-Pacific leads the dataset with a substantially higher installed capacity, reflecting concentrated manufacturing, integrated resin supply, and strong downstream beverage and packaging demand. North America and Europe show significant but more comparable capacities, shaped by mature recycling systems, established fill lines, and regulatory frameworks that influence production balances. Latin America and Middle East & Africa register lower capacities, indicating either developing markets, smaller population centers with lower per-capita bottle consumption, or logistics and feedstock constraints that limit large-scale PET bottle operations. Capacity distribution has direct implications for supply chain resilience and trade flows. Regions with excess capacity can act as exporters of preforms or finished bottles and influence global pricing during demand shocks. Conversely, regions with limited capacity are more sensitive to feedstock price volatility and transportation disruptions. Investment priorities differ: high-capacity regions focus on upgrading lines for lightweighting, mono-material designs, and improved recyclability, while emerging regions often prioritize capacity expansion and establishing basic circular infrastructure. Policymakers and procurement teams can use this distribution to identify risk concentrations and opportunities for regional partnerships. For example, expanding local recycling and rPET integration in regions with high capacity can reduce reliance on virgin resin imports. Similarly, targeted investments in logistics and feedstock access in lower-capacity regions can unlock local manufacturing potential and reduce import dependence. Overall, the chart highlights where production is concentrated today and where strategic interventions could shift capacity balance in the coming years.

Top Selling Products

Subscribe To Our Newsletter

For inquiries about our products or pricelist, please leave your email to us and we will be in touch within 24 hours.

Follow Us

on our social media
  • whatsapp (1)
  • instagram
  • youtube