




Custom PET Cups - China Manufacturer for Quality PET Cups
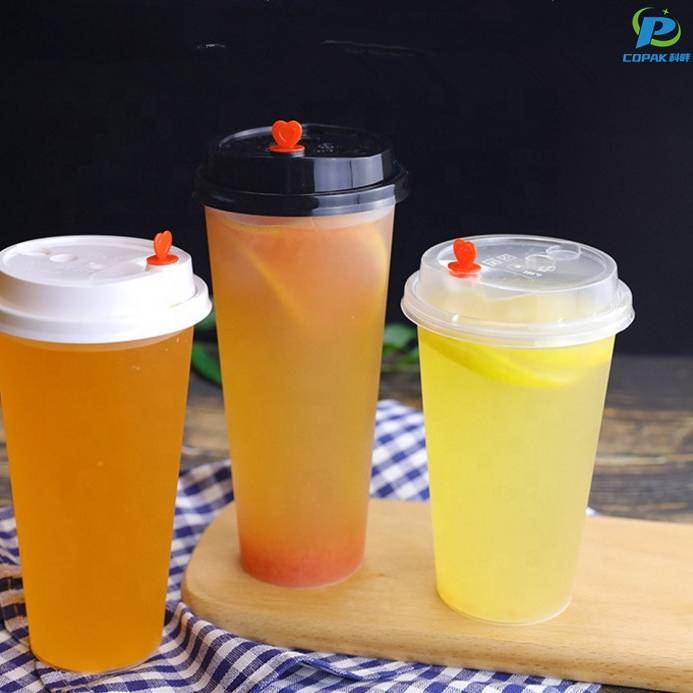
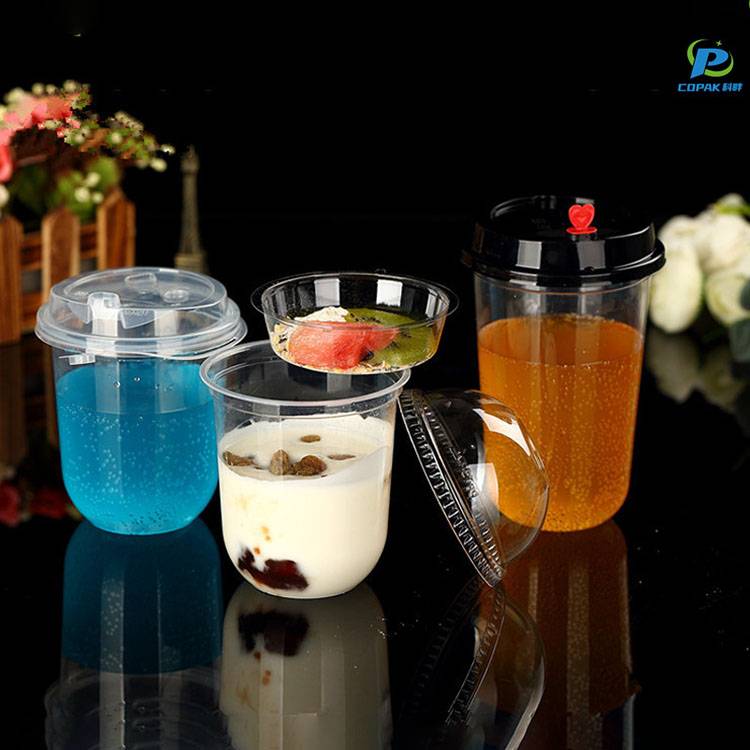
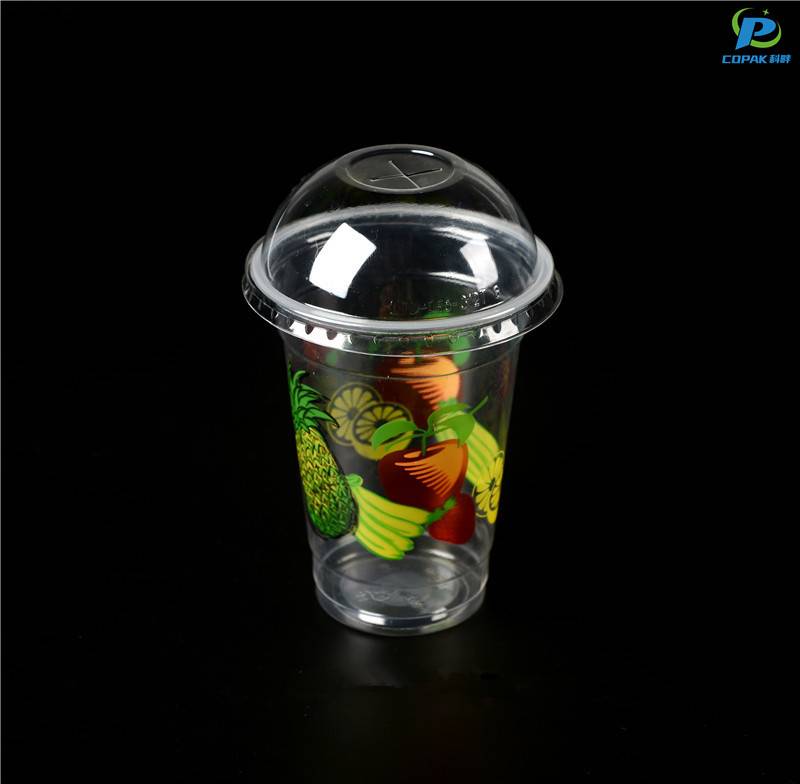
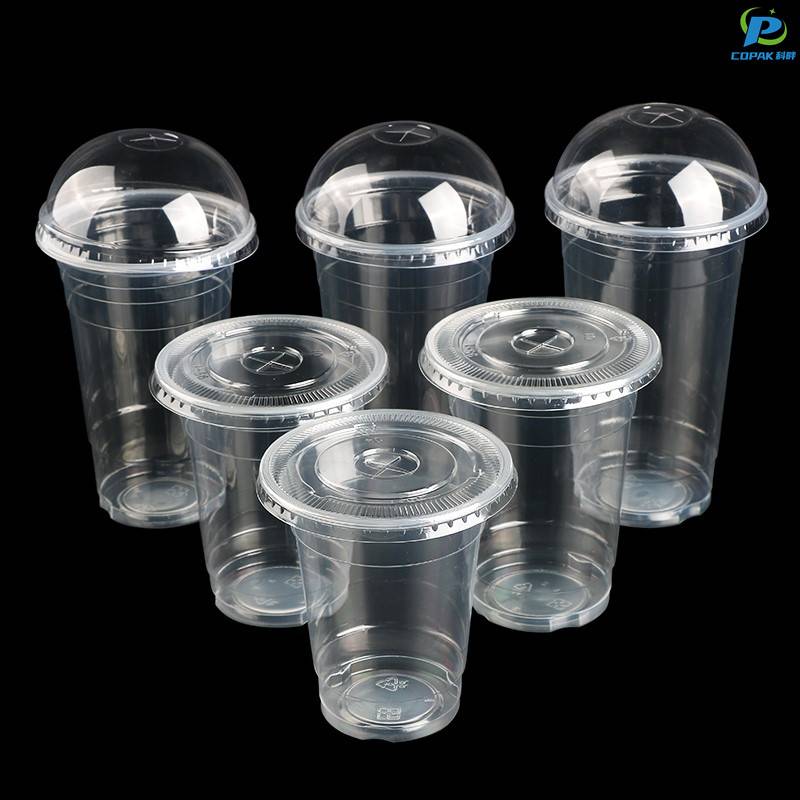
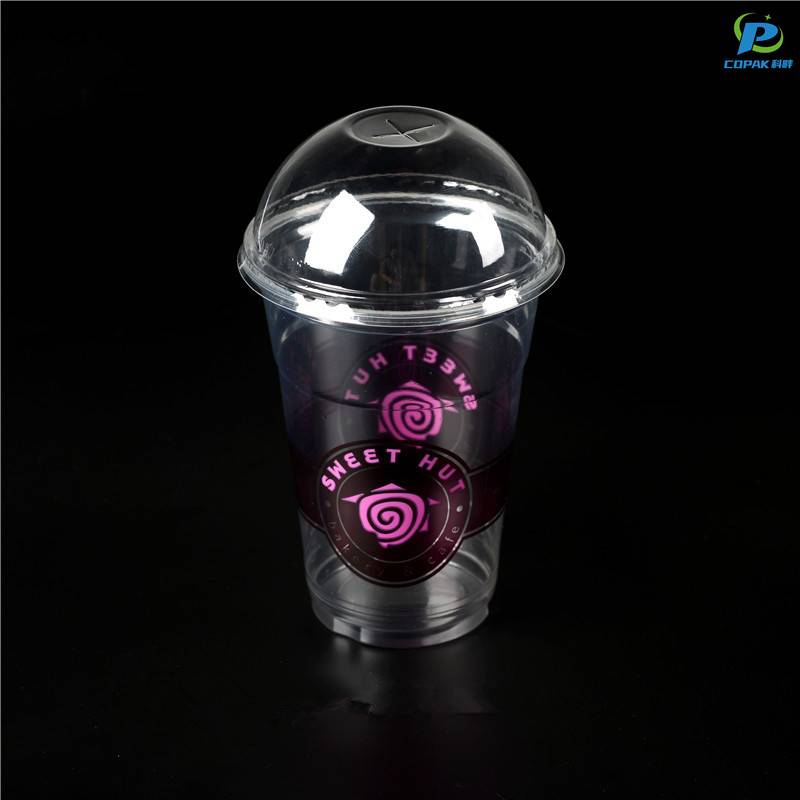
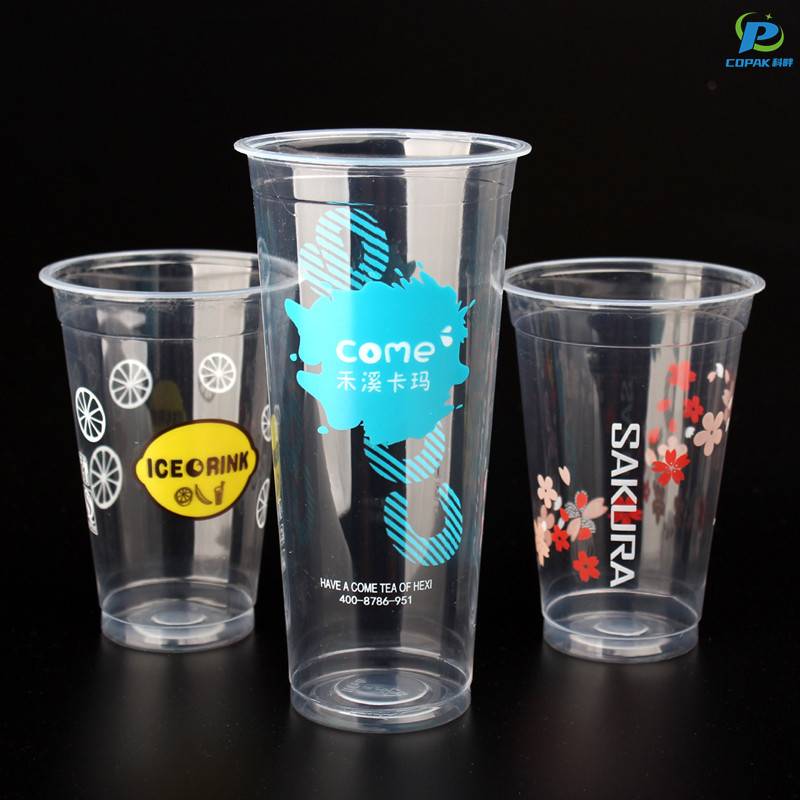
From my factory floor in China, I craft Custom PET Cups for customers who demand reliable quality and flexible customization. As a Manufacturer with years of experience, I offer a wide range of sizes, thickness options, and printing capabilities to match your brand. I work directly with B2B buyers to ensure fast lead times, consistent cup shape, and food-grade safety standards. Our Custom PET Cups are lightweight, crystal-clear, and can be customized with logos, colors, and even microwave-safe labels. We use BPA-free PET, recyclable materials, and comply with EU/US standards. I can provide pre-production samples, MOQ guidance, and freight quotes tailored to your destination. Communication is straightforward, and I can ship from China to your warehouse, helping you streamline procurement. If you want a trusted partner who can scale with your orders, I’m ready to discuss your project, from design to delivery, with the goal to boost your brand impact.


Custom PET Cups From Concept to Delivery Outperforms the Competition
From concept sketches and 3D prototypes to final cartons, custom PET cups can be engineered to outperform off-the-shelf alternatives. Experienced design and production teams ensure selection of food-safe, recyclable PET grades, optimized wall thickness, barrier and anti-fog options, and high-fidelity printing or labeling. Rapid prototyping and iterative samples reduce time-to-market while preserving brand aesthetics and functionality for single-serve, multipack, or refillable formats. Robust in-line quality control, ISO-aligned processes and batch traceability guarantee consistency at scale. Flexible tooling, consolidated packaging and global logistics lower landed cost and shorten lead times. For global buyers seeking reliable, compliant and sustainable packaging that differentiates on shelf and in use, a partner-focused production chain delivers measurable performance advantages from first prototype to delivery.
| Metric | Specification / Range | Measured Value (Example Batch) | Industry Benchmark / Avg | Notes |
|---|---|---|---|---|
| Material | Food-grade PET (clear, amorphous) | PET (high-clarity, food contact) | Standard food-grade PET | Optimized for clarity and thermoforming |
| Density | 1.36 – 1.40 g/cm³ | 1.37 g/cm³ | ~1.38 g/cm³ | Consistent raw-material control |
| Wall thickness | 250 – 350 µm | 300 µm (±20 µm) | ~300 µm | Optimized for stiffness and material use |
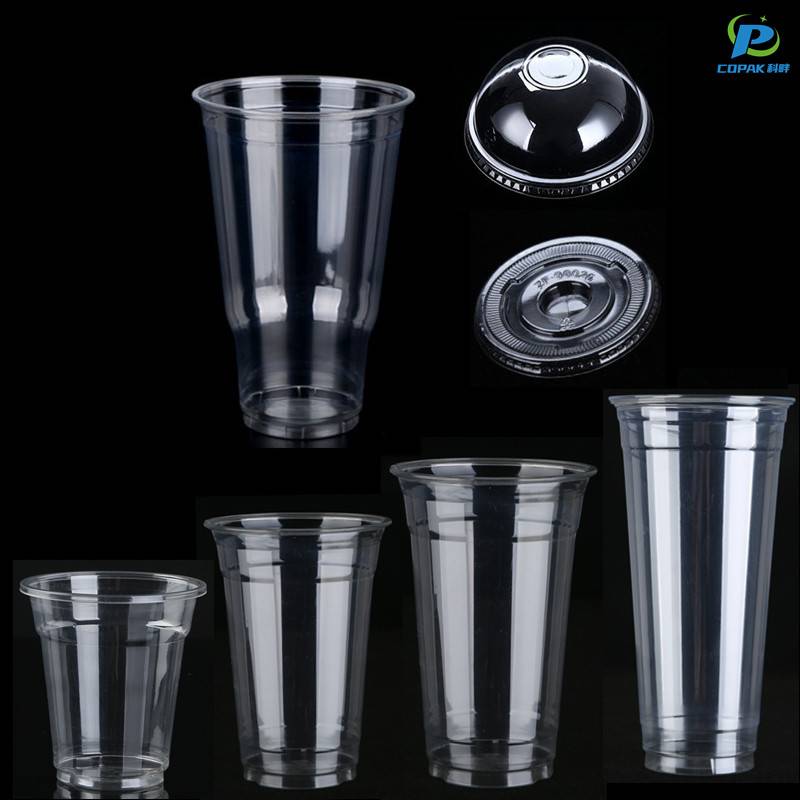
| Capacity range | 60 – 500 ml (2 – 16 oz) | Common sizes: 90, 240, 355, 473 ml | Similar market range | Tooling supports multiple cavities and sizes |
| Average cup weight | 6 – 14 g (depends on size) | 12 oz cup: 10.5 g | 11.0 g | Material-optimized design lowers weight while maintaining strength |
| Mold cavities | 4 – 24 cavities | 12 cavities (example line) | 8–12 typical | Higher cavities increase throughput for large runs |
| Cycle time | 1.5 – 3.5 s | 2.2 s | ~2.5 s | Stable cycle from optimized process control |
| Throughput | 5,000 – 25,000 cups/hour (line-dependent) | ~19,600 cups/hour (12-cavity, 2.2 s) | ~15,000 cups/hour | High-efficiency lines with predictive maintenance |
| Lead time (concept → delivery) | 6 – 16 weeks (project dependent) | 9 weeks (concept to delivery example) | ~12 weeks | Includes tooling, prototyping, and QC |
| First-pass yield | 95 – 99% | 98.2% | ~95% | Tight process controls and inline inspection |
| Defect rate (scrap) | 0.5 – 6% | 1.8% | ~5% | Most defects are cosmetic or trimming-related |
| Seal strength | 8 – 15 N (dependent on lid design) | 12 N (consistent seals) | ~10 N | Measured per ASTM-style peel test |
| Drop-test pass rate | 90 – 99% | 99% (standard 1 m drop test) | ~95% | Design reduces cracking and deformation |
| Print registration accuracy | ±0.2 – ±0.6 mm | ±0.3 mm | ±0.5 mm | Supports high-resolution rotogravure and digital UV |
| Dimensional tolerance | ±0.3 – ±0.6 mm | ±0.5 mm | ±0.7 mm | Measured at critical diameters and stack height |
| Barrier performance (O2 permeability) | 1.5 – 6 cc/m²·day | 2.8 cc/m²·day | ~4.5 cc/m²·day | Good baseline barrier; optional coatings available |
| Recyclability (post-sort) | >80% recovery expected | ~92% recovery rate in sorted stream | ~85% recovery | Designed to meet common recycling streams (PET mono-material) |
| Carbon footprint | Varies by process; reported per 1000 cups | 9.4 kg CO2e / 1000 cups | ~12.0 kg CO2e / 1000 cups | Includes material, production, and typical transport assumptions |
| Temperature resistance (use) | Up to 60 – 70 °C (short-term) | Functional up to 65 °C | ~60 °C | Suitable for cold and most warm beverages (not for boiling) |
| Certifications & compliance | Quality and environmental standards; food contact | ISO 9001 / ISO 14001; food contact compliance (EU/US guidelines) | Common industry certifications | Documentation available for audits and customer review |
| Typical printing methods | Rotogravure, Offset, Digital UV | Rotogravure & Digital UV used on example batch | Same methods widely used | Supports full-color, metallic effects, and variable data |
Related Products




Custom PET Cups Where Innovation Meets 2025 More Than a Supplier - A Partner
Top Selling Products


- Related Blog
- Reviews
- Reviews
