PET Bottles

Plastic Soft Drink Bottles - China Manufacturer

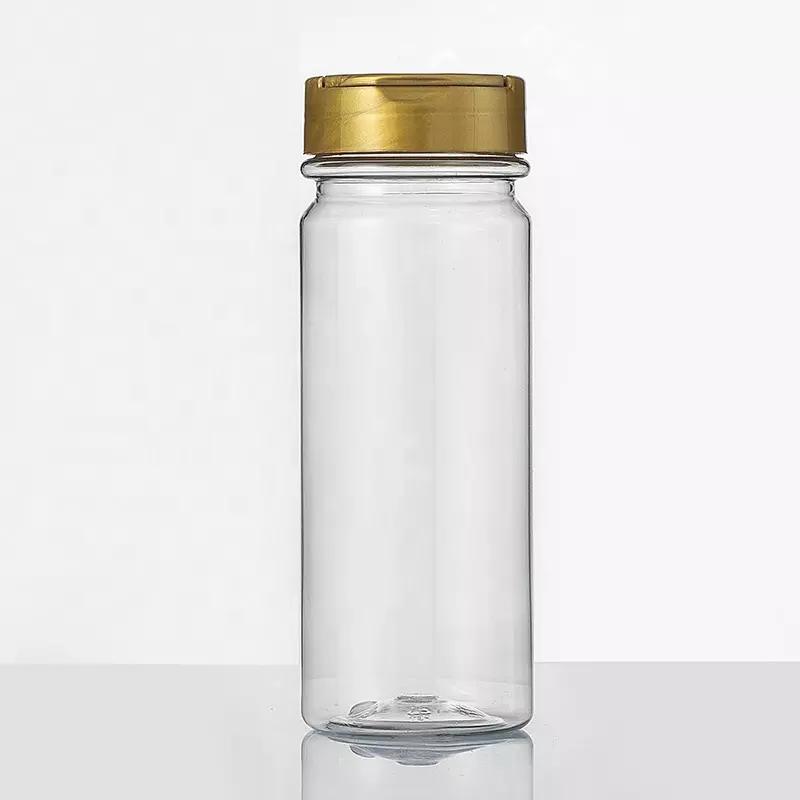
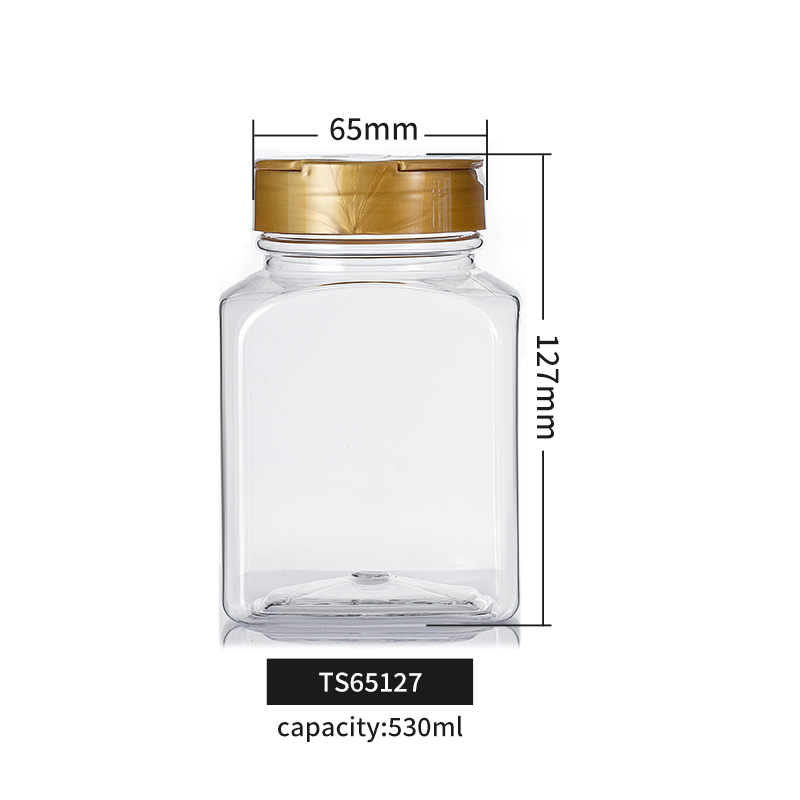
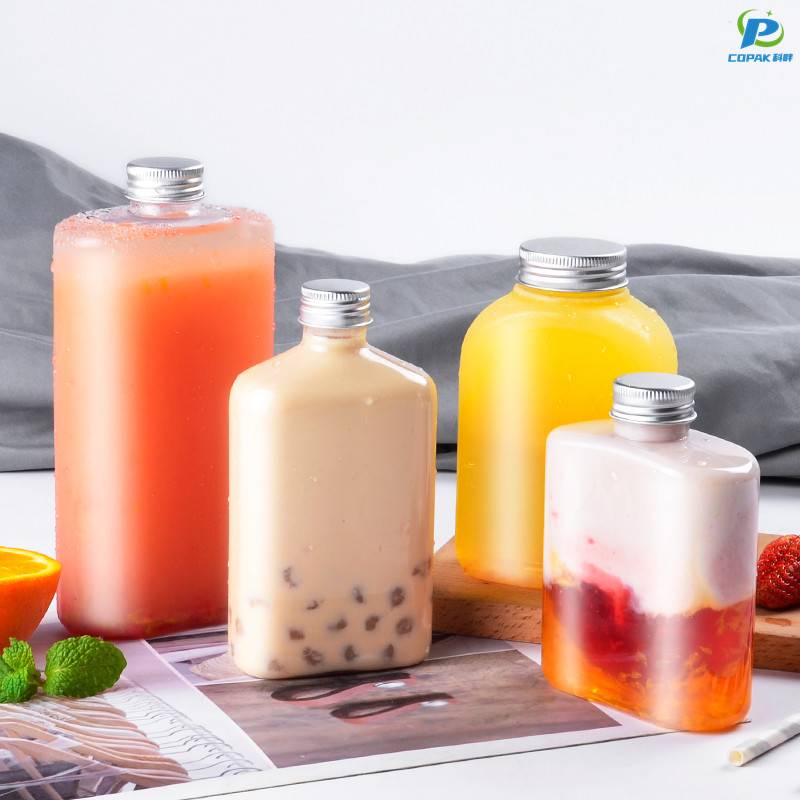
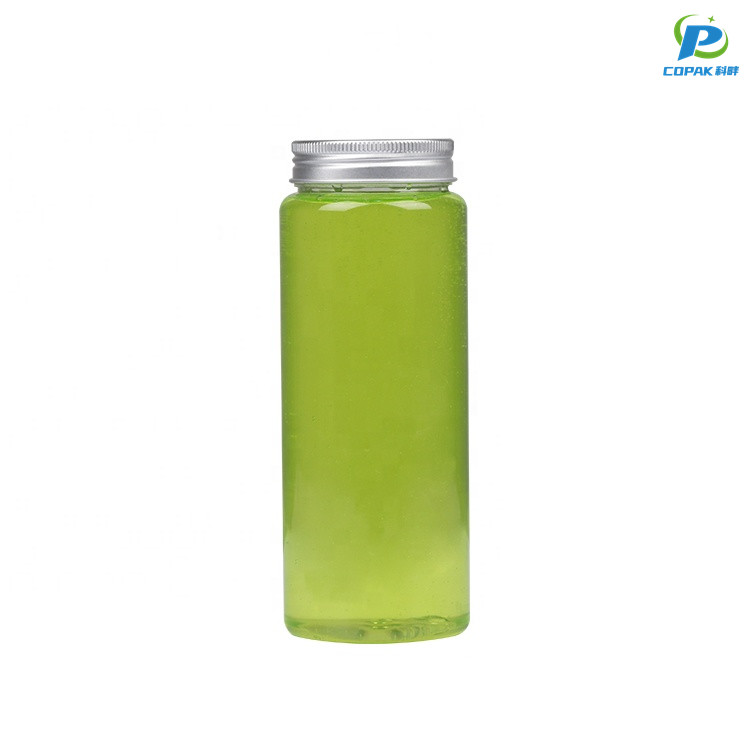
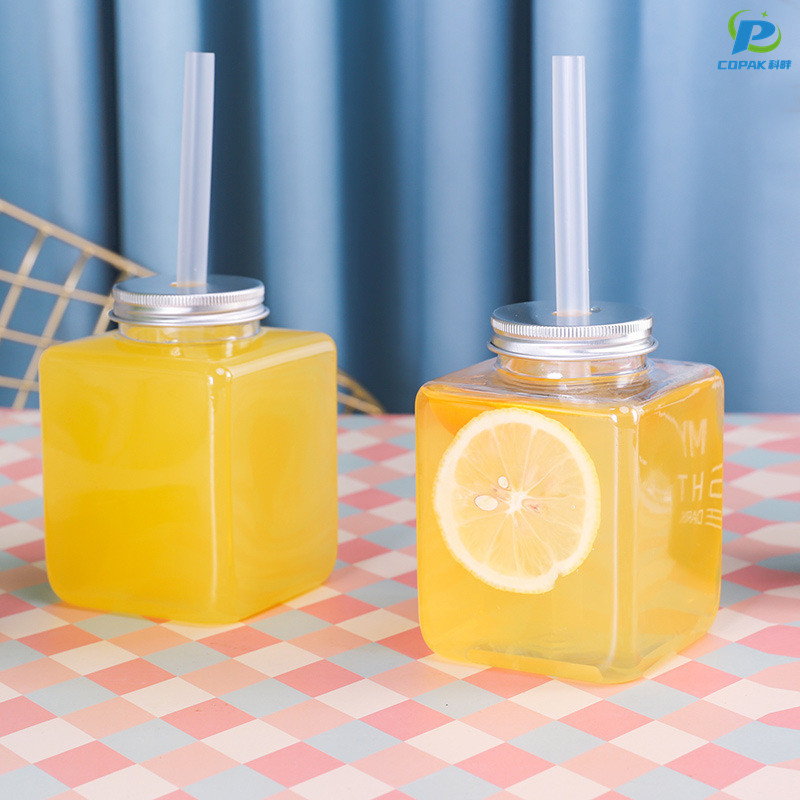
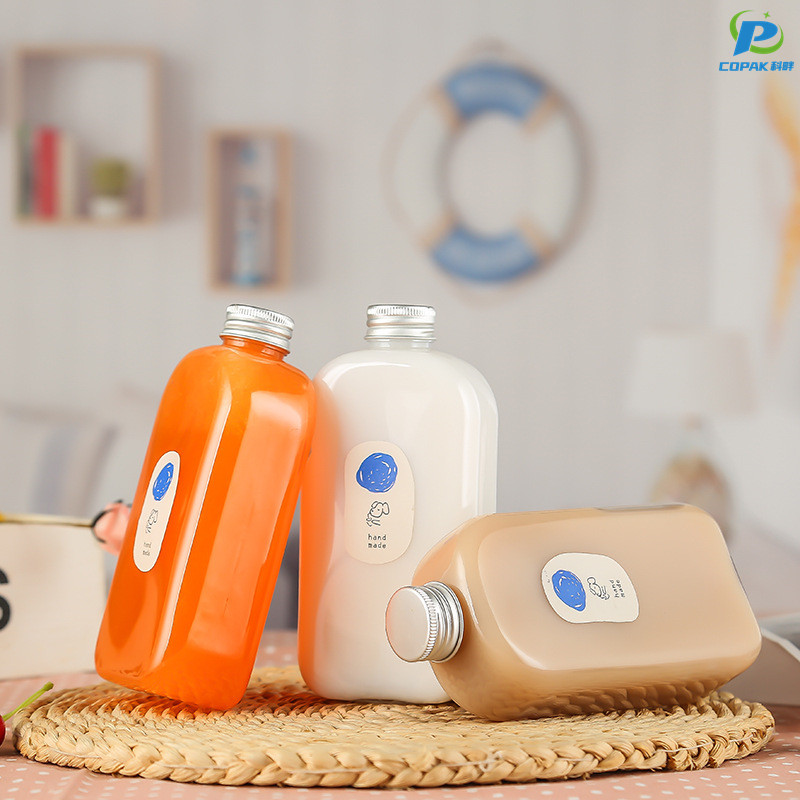
We are a China-based Manufacturer offering Plastic Soft Drink Bottles designed for brands, distributors, and retailers. Our bottles use food-grade PET, are BPA-free, and come with leak-proof caps and tamper-evident options. We offer sizes from 200ml to 2L with standard 28mm or 38mm neck finishes, and we can customize shapes, colors, and print up to 4 colors with your logo. We support flexible MOQs and short lead times to match your demand. Certifications like SGS and FDA are in place for safety in soft drinks, juice, or sparkling beverages. Lightweight and recyclable, these bottles help cut shipping costs and support sustainability. If you’re in China or seeking a reliable Manufacturer partner, we’re ready to discuss your packaging specs, pricing, and samples today.

Hot Selling Product

Plastic Soft Drink Bottles Ahead of the Curve Service Backed by Expertise

Our plastic soft drink bottles combine advanced preform technology and lightweight engineering to deliver consistent fill accuracy, reliable barrier performance and an eye-catching finish. Available in a wide range of capacities, neck finishes and custom colors or print options, each batch is produced to meet global food-contact standards and undergoes rigorous quality testing and inspection to ensure consistency from first sample to full production. Backed by experienced technical support and streamlined production, we serve global procurement teams with flexible MOQs, scalable capacity and dependable lead times. From prototype and mold optimization to certified testing, tailored packing and international logistics, the focus is on minimizing risk, reducing landed cost and accelerating time-to-market—while offering sustainability choices such as PCR content and transport-efficient packaging.

{ Plastic Soft Drink Bottles Ahead of the Curve Service Backed by Expertise}

Material Bottle Type Capacity (mL) Wall Thickness (mm) Typical Mass (g) Recyclability Rate (%) Common Fill Tensile Strength (MPa) Elongation at Break (%) Estimated CO2e per Bottle (g)
PET (virgin) Standard narrow-neck 330 0.35 10 60 Carbonated soft drinks 55 120 55
PET (lightweight) Slim lightweight 330 0.28 8 60 Carbonated soft drinks 50 130 45
PET Sports-style (narrow) 500 0.40 14 58 Still soft drinks 58 110 70
rPET (30% PCR) Standard narrow-neck 330 0.36 11 85 Carbonated soft drinks 52 115 40
HDPE Wide-mouth / jug 1000 0.90 40 60 Non-carbonated beverages 30 400 120
Multi-layer PET (barrier) Barrier for oxygen-sensitive 500 0.45 18 40 Flavored / extended shelf 60 100 95
PET (bulk) Large-format (wide-mouth) 1500 1.00 45 55 Bulk soft drink dispensing 60 90 160
Bio-PET (30% bio-based) Standard narrow-neck 330 0.36 11 60 Carbonated soft drinks 55 120 50
Technical snapshot Values reflect typical commercial bottle constructions and average environmental impact estimates; regional recycling and processing performance may vary.

Related Products

PET Cups

Plastic Soft Drink Bottles For the Current Year Now Trending

Regional Volume Distribution of Plastic Soft Drink Bottles — Current Year (Millions of Units)

This chart presents estimated regional volumes of plastic soft drink bottles for the current year, measured in millions of units, and highlights observed trends that inform supply chain, recycling, and marketing decisions. Data are grouped by region: North America, Europe, Asia-Pacific, Latin America, Africa, and Middle East. The Asia-Pacific region shows the largest volume, reflecting population size, increasing per-capita consumption, and expanding retail penetration. North America and Europe follow with substantial volumes driven by established markets and high disposable incomes. Latin America displays moderate volume growth tied to urbanization and rising beverage demand, while Africa and the Middle East register lower absolute volumes but higher year-over-year growth rates, suggesting future market potential. Seasonal variation, local consumption habits, packaging preferences, and regulatory shifts toward lightweight and recyclable materials also shape these values. For stakeholders, higher-volume regions indicate where logistics, production capacity, and distribution investments will have the most immediate impact. Conversely, regions with accelerating growth represent opportunities for early investment in sustainable packaging innovations and circular economy initiatives. Recycling infrastructure and policy incentives are critical moderating factors: regions with stronger recycling programs can achieve higher recovery rates, influencing both raw material sourcing and brand stewardship. Retail and bottling partners can use the distribution profile to optimize SKU assortments, promotional calendars, and E-commerce fulfillment strategies. Environmental planners and policymakers can prioritize targeted programs where volumes are high but recycling rates are low, maximizing ecological benefit per intervention. While absolute numbers provide a snapshot, combining this volume data with per-capita consumption, projected population growth, and regulatory scenarios will yield a robust three- to five-year strategic plan. The chart is intended as an illustrative baseline for comparative analysis and should be supplemented with localized market intelligence for tactical implementation. Data sources and assumptions should be transparently documented to improve confidence and reproducibility globally consistently.

Top Selling Products

Subscribe To Our Newsletter

For inquiries about our products or pricelist, please leave your email to us and we will be in touch within 24 hours.

Follow Us

on our social media
  • whatsapp (1)
  • instagram
  • youtube