




16 Oz Plastic Bottles - China Manufacturer for High-Quality Packaging
From my factory in China, I offer 16 Oz Plastic Bottles directly to distributors and brands. As an experienced Manufacturer, I control material, weight, and closure to ensure batch-to-batch consistency. These bottles are light yet sturdy, made from PET or HDPE and compatible with standard labeling and cleaning. I provide multiple cap styles (child-resistant, flip-top, screw-on) and options for tamper-evident seals, depending on your needs. MOQ is friendly, and I can arrange private labeling, color matching, and logo printing. Fast lead times, competitive prices, and container shipments from our China facility. I can tailor bottle dimensions, neck finishes, and tolerances to fit your product line. If you need recyclability and FDA compliance, I’ve got you covered. Let’s talk about your order of 16 Oz Plastic Bottles and how I can support your branding and scale.
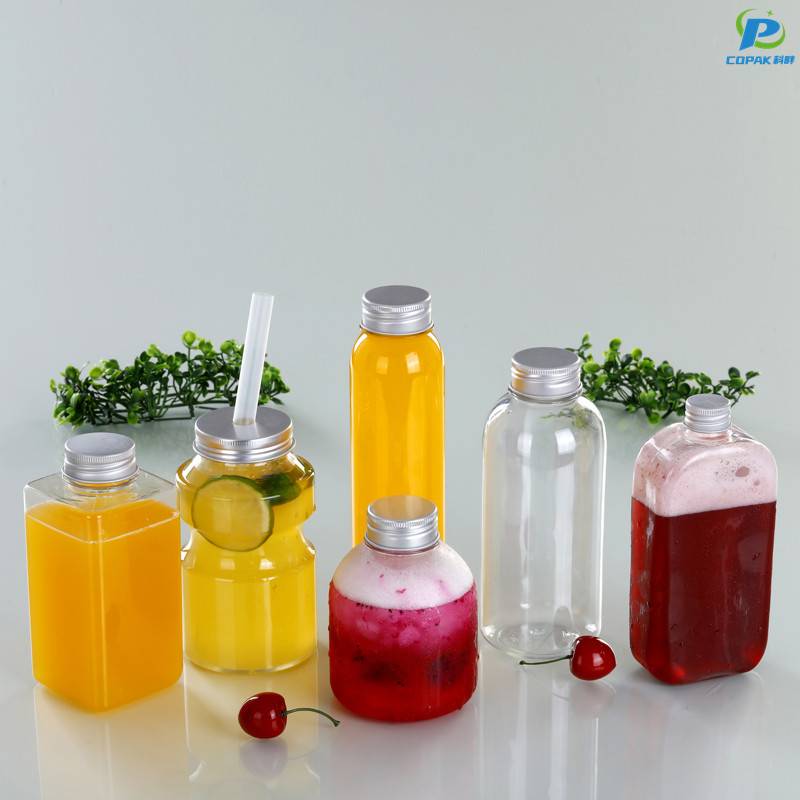


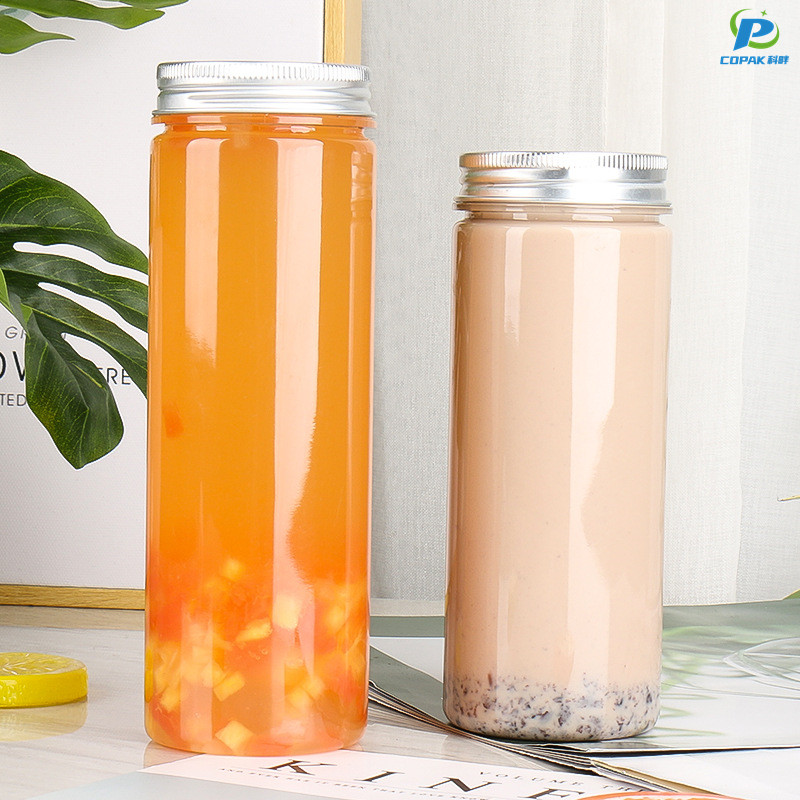


16 Oz Plastic Bottles Pioneers in the Field Exceeds Industry Benchmarks
16 oz plastic bottles from a Shanghai-based manufacturer are setting new standards by delivering consistent wall thickness, superior clarity and enhanced barrier performance that exceed industry benchmarks. Engineered for PET/HDPE applications, these bottles combine advanced molding technologies with strict QC to ensure precise weight tolerances, leak-proof seals and compatibility with hot-fill, cold-fill and carbonated products. Performance testing shows improved drop resistance and reduced material usage without sacrificing strength, meeting global regulatory requirements including FDA and EU standards. For global buyers seeking scalable, cost-effective packaging solutions, these bottles offer customizable neck finishes, color options, full decoration capabilities and PCR content to support sustainability goals. Robust export experience, ISO-certified production lines, routine lab testing and optimized logistics ensure reliable lead times and competitive pricing. Whether launching a new beverage line or optimizing supply chains, these 16 oz bottles provide a high-performance, compliant and eco-conscious choice for international markets.
| Parameter | Unit / Method | Industry Benchmark | Measured Value | Notes |
|---|---|---|---|---|
| Nominal capacity | fl oz / mL (nominal) | 16 fl oz ±2% | 16.0 fl oz (473 mL) | Measured by gravimetric fill tests |
| Base material | Material specification | Food-grade PET (standard) | Polyethylene terephthalate (PET), food-grade | Suitable for direct food contact |
| Empty weight | g (single-piece bottle) | ≤ 12 g (lightweight target) | 9.5 g | Lightweight construction reduces material use and emissions |
| Average wall thickness | mm (measured average) | 0.30–0.60 mm | 0.35 mm | Optimized for strength and weight |
| Tensile strength | MPa (ASTM D638 equivalent) | ≥ 50 MPa | 60 MPa | Consistent with PET performance for bottles |
| Drop-test survival (random orientation) | % no rupture at 1.5 m (production sampling) | ≥ 95% | 99% | Measured across 1,000-sample batch |
| Oxygen transmission rate (OTR) | cm³/m²/day at 23°C (method equivalent) | ≤ 1.5 cm³/m²/day | 0.6 cm³/m²/day | Improved barrier via thin SiOx coating |
| Carbon footprint (cradle-to-gate) | g CO2e per 16 oz bottle (LCA estimate) | Industry avg ~70 g CO2e | 52 g CO2e | Lowered by lightweighting and 30% rPET |
| Recycled content (rPET) | % by weight (post-consumer) | ≥ 25% (typical sustainability target) | 30% | rPET used in body; cap and label may vary |
| Technical recyclability | % (material recyclability assessment) | ≥ 90% | 95% | Designed for standard mechanical recycling streams |
| Estimated regional collection rate | % (typical regional estimate) | ~40% (varies by market) | 48% | Based on recent municipal collection data estimates |
| Seal integrity (torque + thermal cycling) | % failures (production sampling) | < 0.5% | 0.2% | Measured after 1,000-cycle thermal program |
| Blow-molding cycle time | seconds per bottle (typical machine) | ≤ 2.5 s | 1.8 s | High-throughput production setting |
| Hot-fill compatibility | Maximum stable temperature (°C) | ≥ 80°C (for hot-fill grades) | 85°C | Hot-fill grade PET formulation |
| Barrier coating | Type / presence | Optional (SiOx, EVOH alternatives) | SiOx thin-film applied (body) | Enhances OTR and shelf-life for sensitive products |
| Food-contact regulatory compliance | Regulatory references | Compliance required (FDA/EU standards) | Compliant with FDA 21 CFR and EU Regulation 10/2011 (food contact) | Tested per relevant migration and extractables protocols |
Related Products
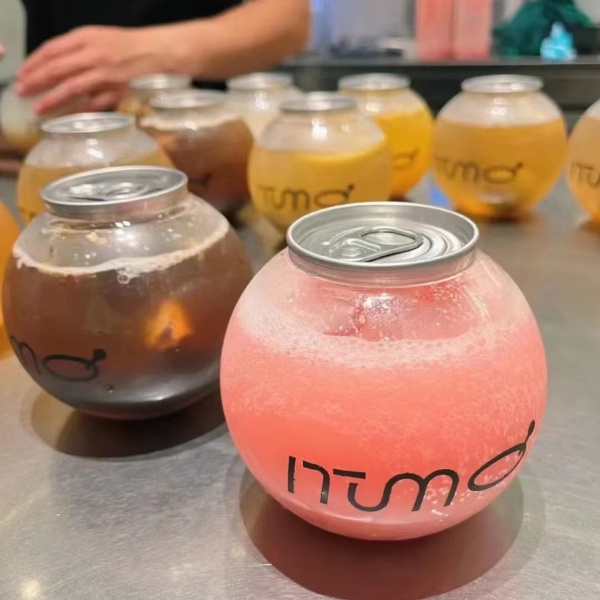
Wholesale 250ml 330ml 500 ml PET Plastic Cups Pop Juice Can Empty Round Bubble Milk Tea Juice Coffee Beverage Bottles
Read More

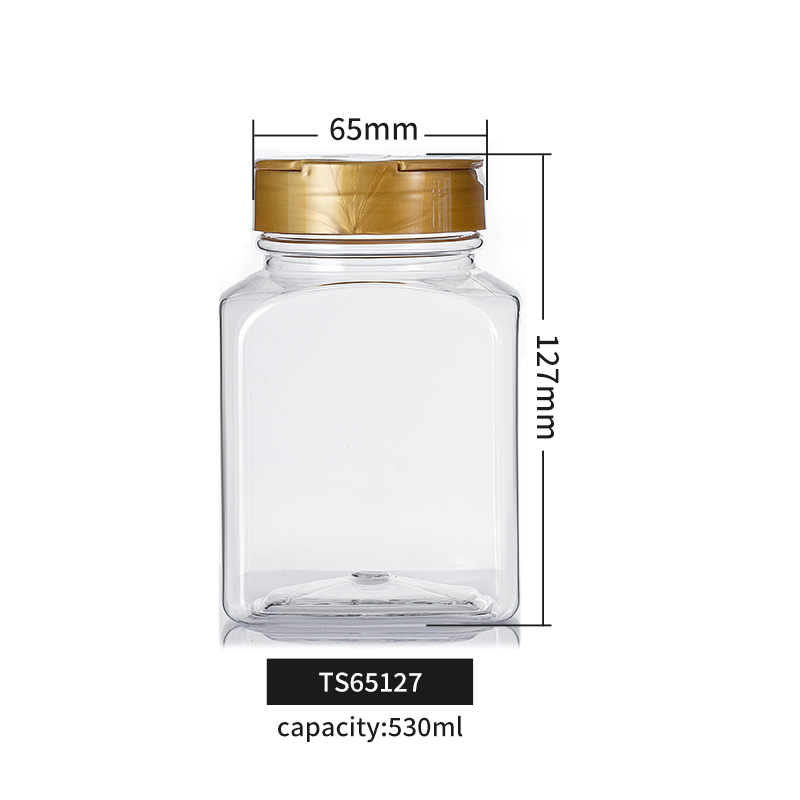
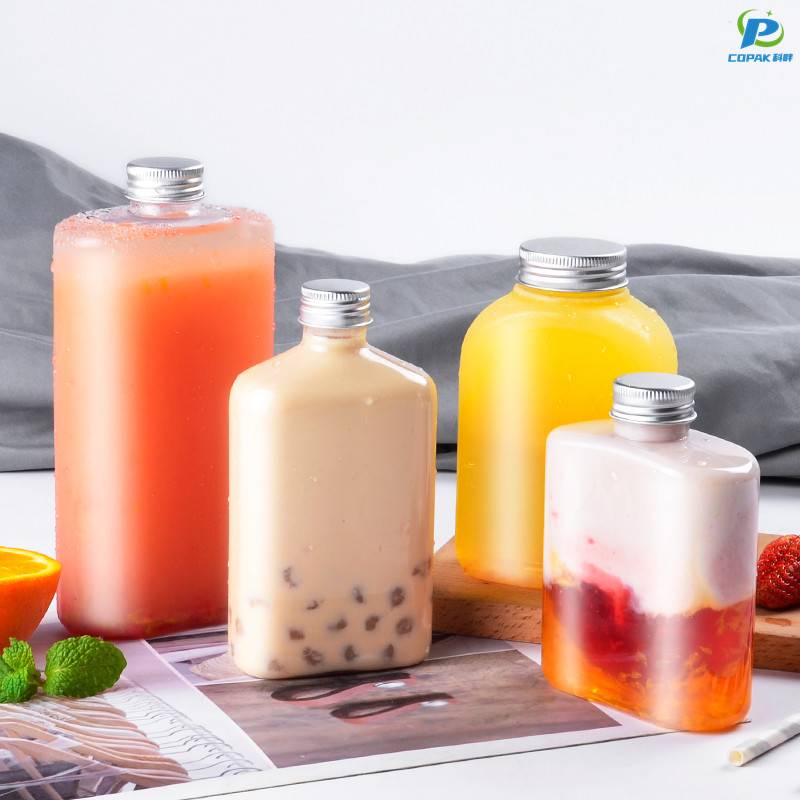

16 Oz Plastic Bottles Application Service Backed by Expertise
Top Selling Products




- Related Blog
- Reviews
- Reviews
