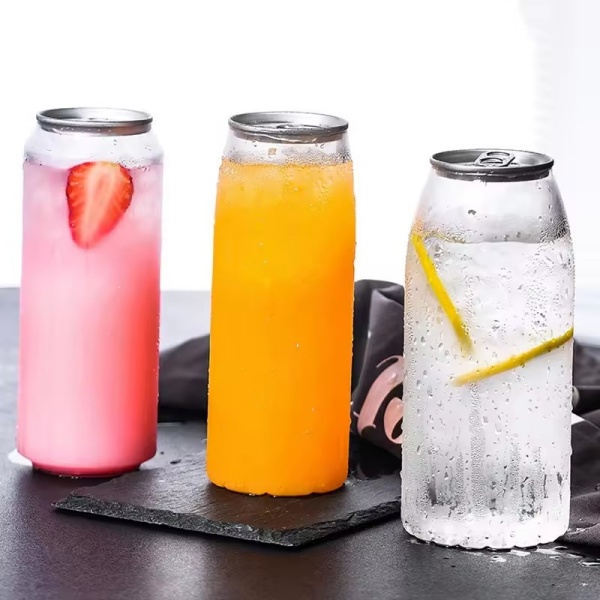
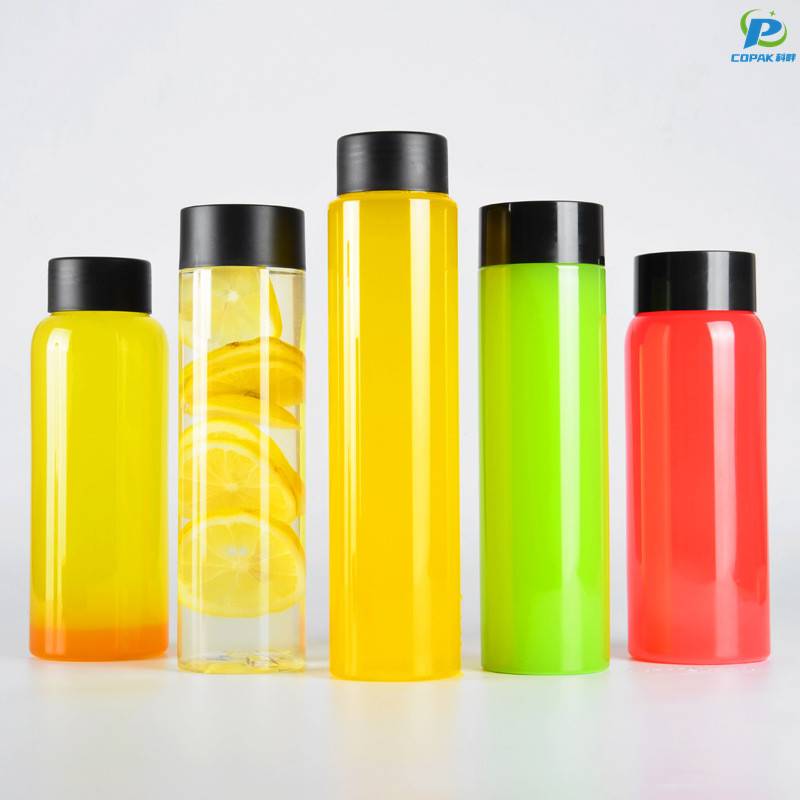
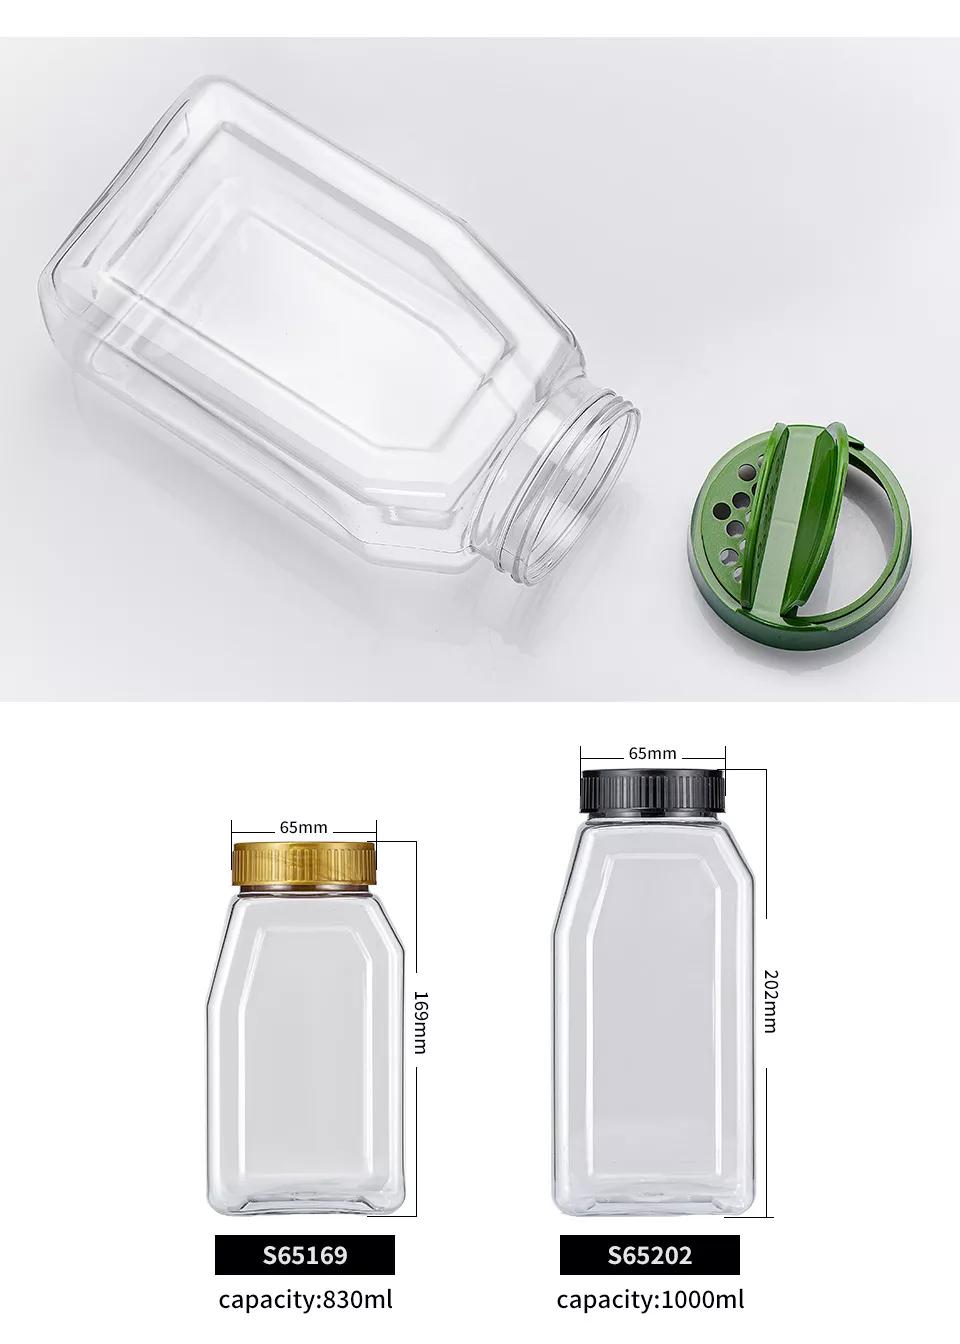
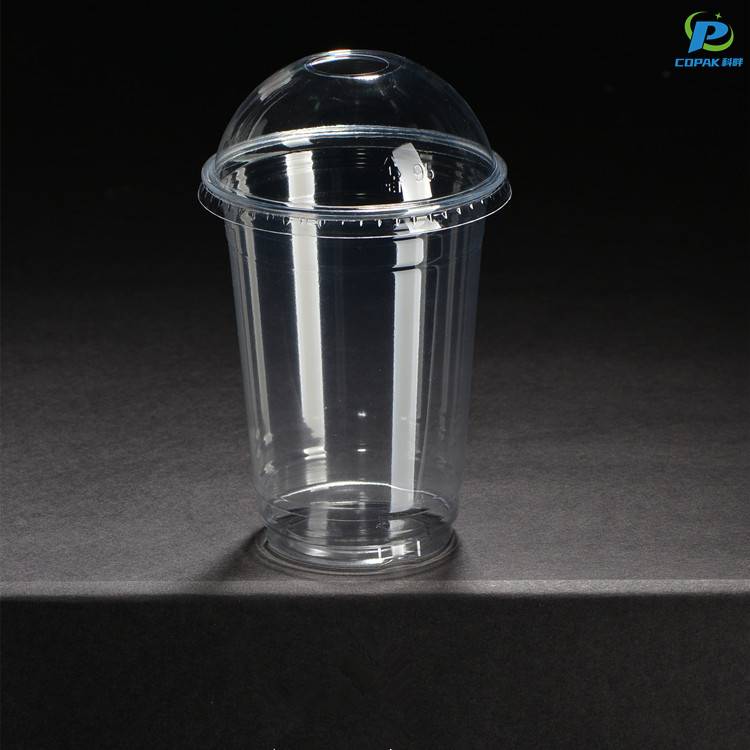
As a China-based Manufacturer, I understand B2B buyers hunt for reliable Disposable Transparent Cups that blend clarity, safety, and value. Our cups are crystal-clear, food-grade, leak-resistant, and stackable, ideal for beverage service, tastings, and take-away display. They fit standard lids and ship in flexible packaging to support your inventory strategies. We offer a broad range of sizes and thicknesses, custom printing options, and MOQ adjustments to scale from pilot orders to full-scale launches. With direct factory pricing, stable supply, and strict quality control, you can count on on-time delivery and consistent performance. We also emphasize recyclability and compliance with food-contact regulations to meet China and global market expectations. Partnering with us means fewer supply hassles and more confidence in your product lineup. Tell me your target volumes, timelines, and labeling needs, and I’ll tailor the quote to fit your distribution chain.
Transparent disposable cups are shaping up as a clear winner in 2025, driven by consumer demand for visible, hygienic packaging and the rise of sustainable alternatives. Innovations in materials—from recyclable PET and rPET to compostable PLA blends—are delivering crystal clarity, strength, and leak-resistance while meeting stricter environmental standards. Product differentiation through anti-fog coatings, stackable designs and tamper-evident lids also boosts convenience for foodservice, retail and events. Global buyers should prioritize partners who can demonstrate consistent quality, certification compliance (FDA, EU food-contact, ISO), flexible customization (sizes, printing, colors) and reliable lead times at competitive scale. Aligning procurement with suppliers that offer traceable materials, circular-economy options and responsive logistics reduces risk and positions your business to capture growing market share as transparent disposables continue gaining preference worldwide.
| Material Type | Transparency (%) | Market Share (2024) | Projected CAGR (2025–2030) | Dominant Use Cases | End-of‑Life Pathway | Recyclability (est.) | Certifications / Notes |
|---|---|---|---|---|---|---|---|
| Clear PET (polyethylene terephthalate) | ≈92% | 45% | 3.5% | Beverage cups (cold drinks), single‑use events, takeaway cold cups | Mechanical recycling where collected; otherwise landfill/incineration | ≈35% | Widely recyclable in curbside/collection streams; ISO 15270 referenced; good clarity |
| rPET (post‑consumer recycled PET) | ≈88% | 6% | 9.0% | Premium clear cups with recycled content; branded sustainability initiatives | Closed‑loop/closed‑loop‑targeted recycling; better circularity in developed regions | ≈60% (in targeted collection streams) | Lower lifecycle GHG vs virgin PET; quality depends on feedstock and sorting |
| Clear Polypropylene (PP) | ≈85% | 20% | 1.5% | Cold cups, lids, thicker disposable cups; good heat tolerance vs PET | Recyclable in select streams; often downcycled | ≈30% | Increasingly used for reclosable/stackable designs; variable collection infrastructure |
| Polystyrene (PS) – clear foam & rigid | ≈90% | 10% | −2.0% | Low‑cost clear cups, deli/foodservice in some regions | Limited recycling; frequently banned/restricted in some jurisdictions | ≈15% | Subject to regulatory decline in several markets; poor compostability |
| PLA (polylactic acid) – compostable bioplastic | ≈88% | 12% | 14.0% | Compostable clear cups for events, cafes with organics collection | Industrial composting (EN 13432 / ASTM D6400 where accepted); not home compostable generally | Variable — depends on access to industrial composting (≈10–30% access) | Popular for “compostable” positioning; lifecycle trade‑offs (agriculture inputs) |
| Cellulose acetate / coated cellulose | ≈78% | 7% | 6.0% | Transparent biodegradable options, niche foodservice cups | Industrial composting or specialized biodegradation; limited mechanical recycling | ≈20% | Growing interest for marine‑degrading variants; certification varies by formulation |