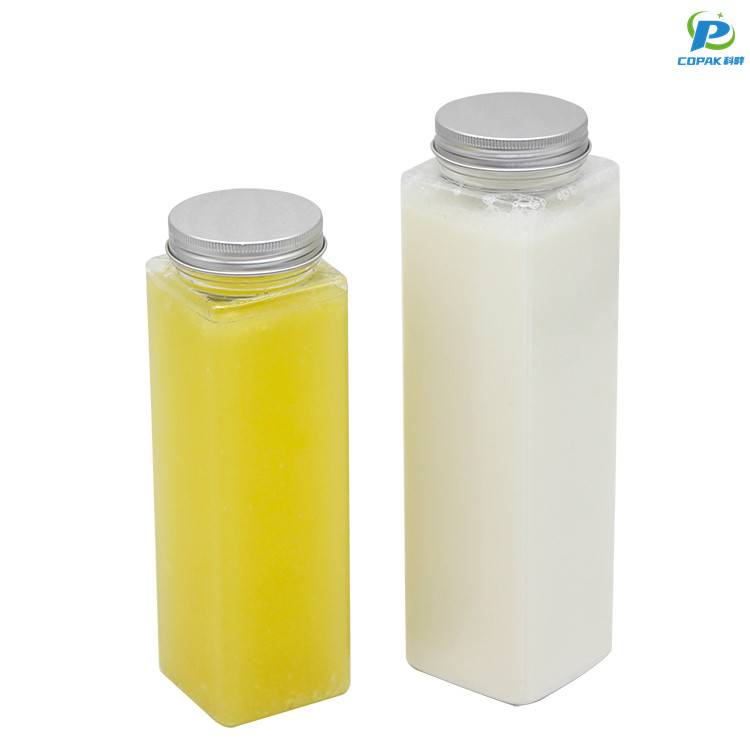
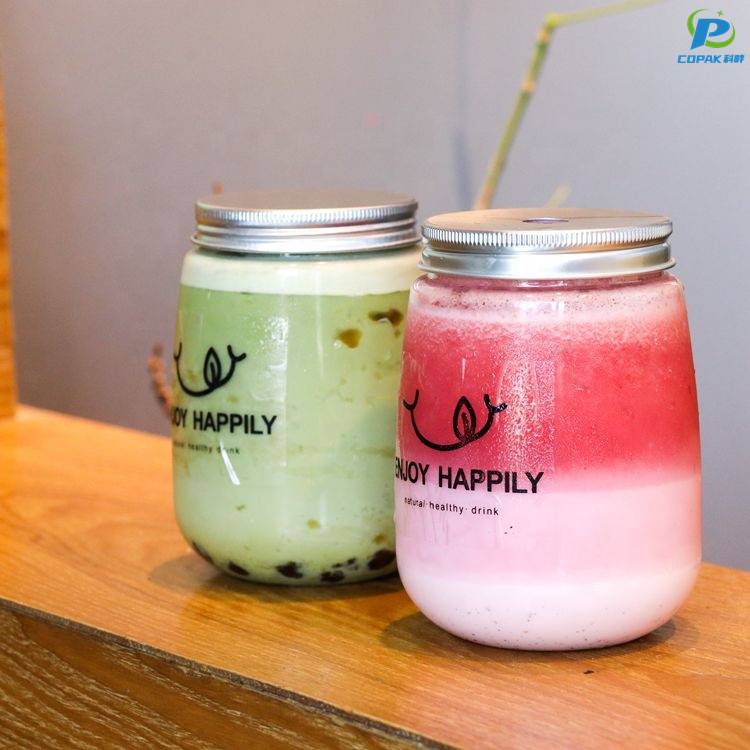
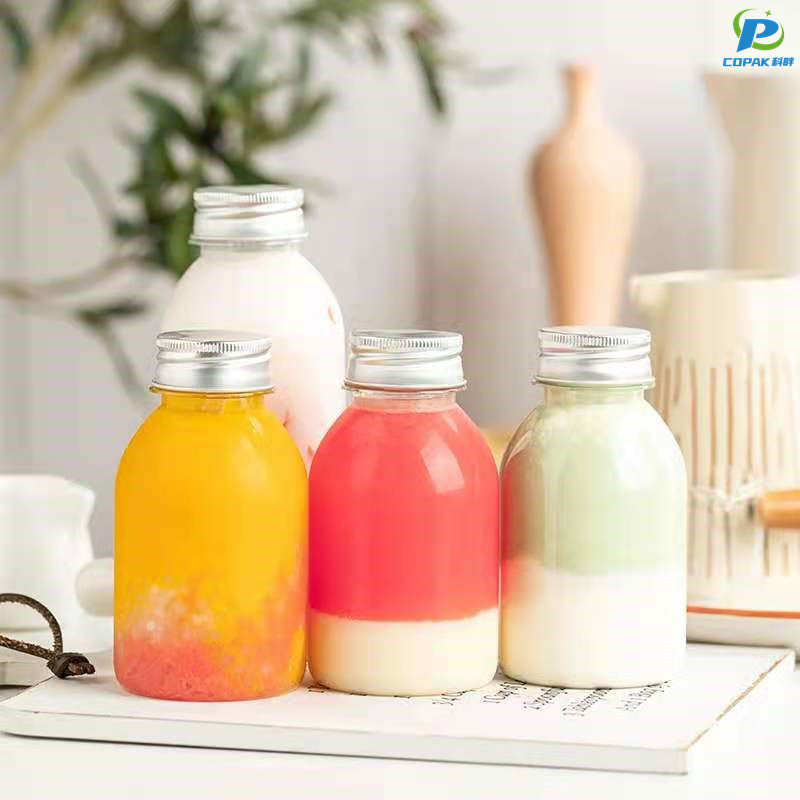
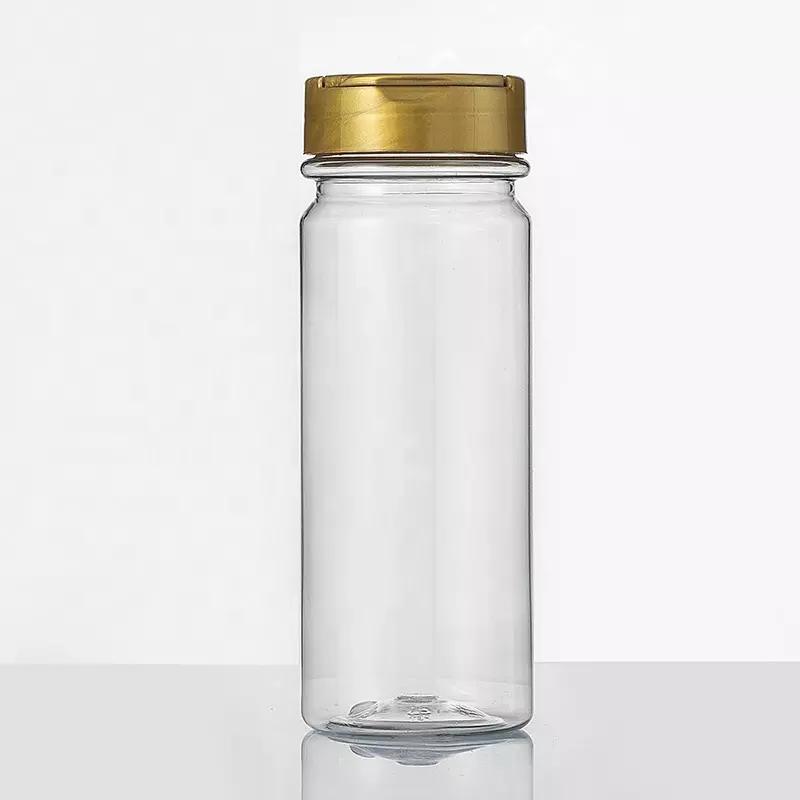
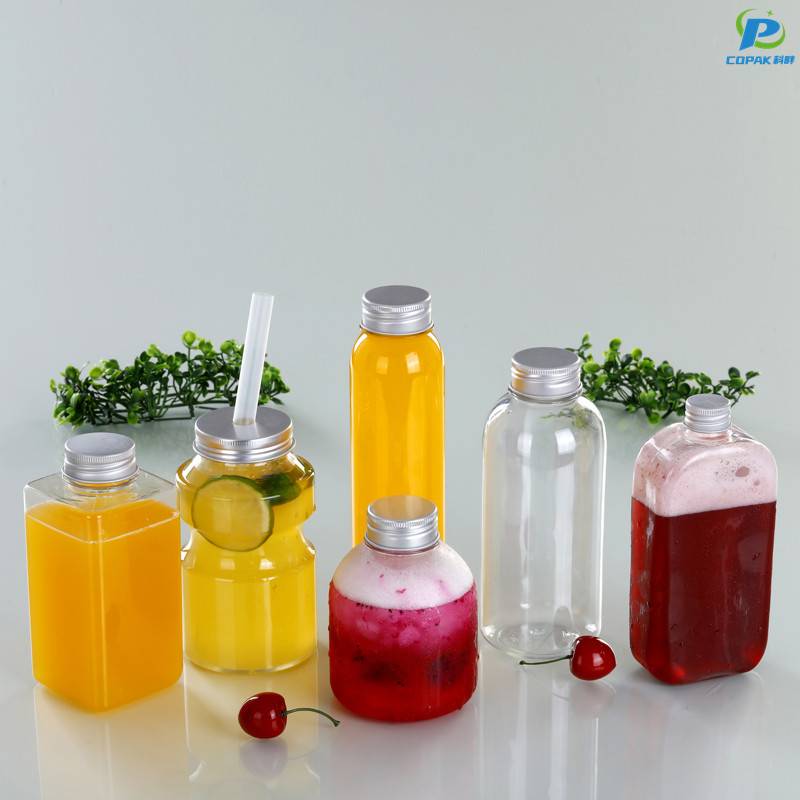
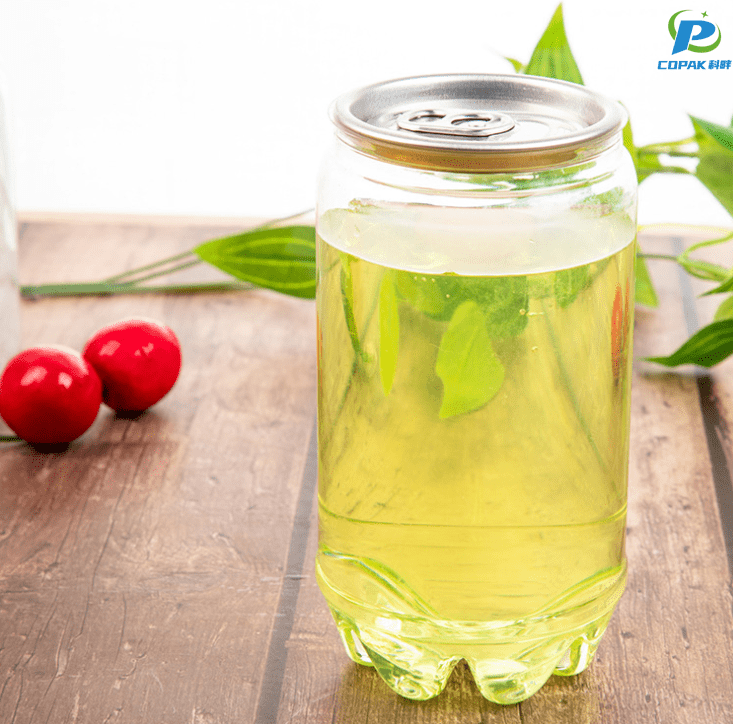
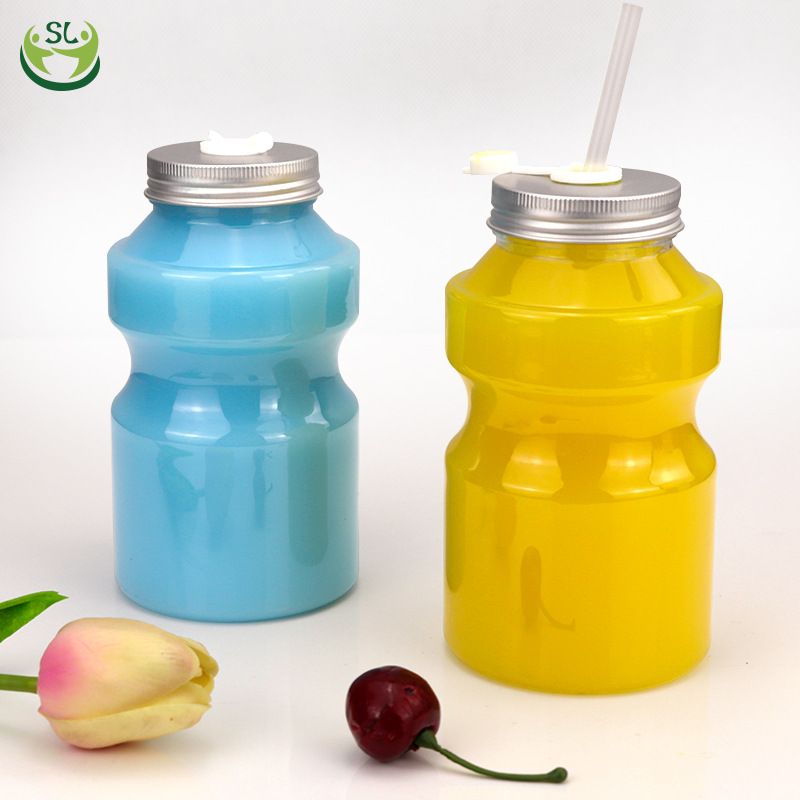
I’m sourcing Clear Juice Bottles that stand out on shelves and during distribution. As a buyer in the beverage world, you’ll appreciate the crystal clarity, light weight, and proven leak resistance. Our bottles are manufactured by a reliable Manufacturer in China, offering consistent wall thickness, smooth threading, and compatibility with standard closures. I offer a range of sizes: 250 ml, 330 ml, 500 ml, with options for PCR or PET options, and can customize labeling, embossing, or color caps. Your branding will pop thanks to their optically clear look and UV protection. For B2B, I can meet your minimum order quantities and quick lead times, plus tamper-evident caps and hot-stamp options. I pay attention to packaging efficiency for shipping and palletizing, to minimize breakage. If you need a transparent packaging solution that communicates quality and safety, I’ve got you covered. Reach out for samples, price breaks, and private labeling today.
Factory-direct clear juice bottles combine optical clarity, food-grade materials, and precise manufacturing to showcase product appeal while controlling costs. From initial concept and rapid prototyping to custom tooling and pre-production runs, buyers benefit from direct access to production expertise: material selection (PET, rPET), barrier and UV options, lightweight designs, and decoration choices like labeling or printing. Strict quality controls, food-safety certifications, and in-line testing ensure consistent fill-line compatibility and shelf stability for global markets. Working directly with the factory streamlines lead times, reduces intermediaries, and enables scalable minimums and competitive pricing for large or regional programs. Integrated logistics support — from pallet optimization to export documentation — plus sustainability options (recycled content, reduced carbon packing) make factory-direct sourcing an efficient strategy for brands seeking transparency, faster time-to-market, and measurable cost and environmental benefits.
| KPI / Metric | Description | Unit | Current | Target | Period |
|---|---|---|---|---|---|
| Production Capacity | Maximum bottles produced per 8-hour shift with current line configuration | bottles/day | 18,000 | 20,000 | Q2 2025 |
| Line Efficiency | Overall line efficiency relative to standard cycle time | % | 92.0 | 95.0 | Q2 2025 |
| Defect Rate | Proportion of bottles rejected due to quality issues | % | 0.75 | 0.40 | Q2 2025 |
| Downtime | Production time lost due to maintenance or stoppages | % | 5.6 | 3.0 | Q2 2025 |
| Material Yield | Raw material conversion efficiency (juice, bottle, cap, label) | % | 98.2 | 99.5 | Q2 2025 |
| Water Usage | Water consumption per 1,000 bottles produced | L/1k bottles | 420 | 350 | Q2 2025 |
| Energy Intensity | Energy consumption per bottle produced | kWh/bottle | 0.18 | 0.15 | Q2 2025 |
| Scrap Rate | Percentage of bottles scrapped during production | % | 0.8 | 0.4 | Q2 2025 |
| On-Time Delivery | Rate of on-time shipments to customers | % | 97.2 | 98.5 | Q2 2025 |
| Complaints per Million Bottles | Customer-reported quality issues per million bottles shipped | per million | 12 | 6 | Q2 2025 |