




Plastic Cups 20 Oz - China Manufacturer of Durable Disposable Cups
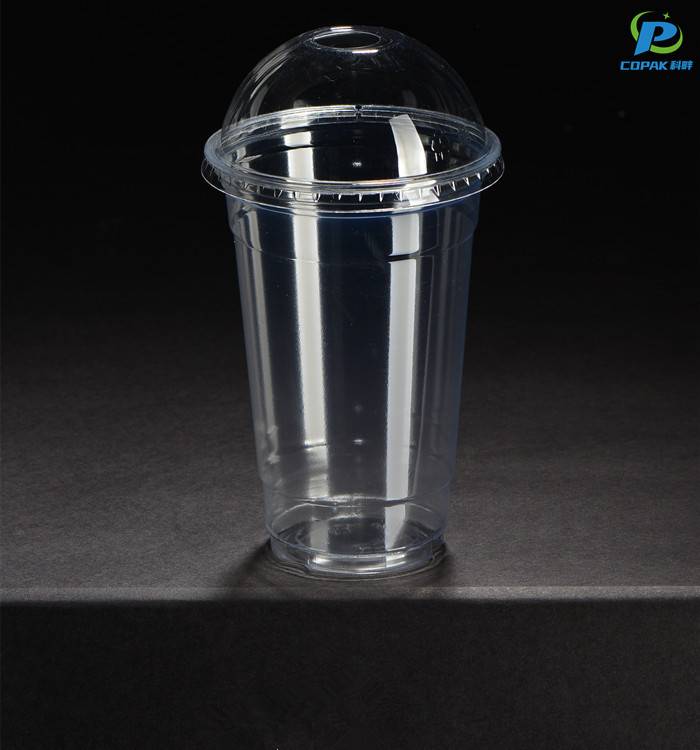
As a China-based Manufacturer, I’m proud to offer Plastic Cups 20 Oz that fit the needs of cafes, caterers, and wholesalers. These cups are crystal-clear, stackable, and designed for reliability, with BPA-free material and sturdy rims for everyday use. I focus on consistent 20 oz capacity, strong leak resistance, and smooth edges that protect both staff and customers. For B2B buyers, I provide strict quality control, scalable production, and favorable lead times, with competitive pricing for bulk orders. Custom branding options are available to boost your brand presence on the cups. We ship directly from China to streamline logistics and reduce delays, with clear MOQs and flexible packaging. Whether you’re expanding a chain or stocking a distribution center, I can tailor packaging, labeling, and timelines to your spec. Let’s discuss your order size, delivery schedule, and certification needs for Plastic Cups 20 Oz.



Plastic Cups 20 Oz Leads the Global Market Your End-to-End Solution
The 20 oz plastic cup has emerged as a global favorite for retailers, event organizers and foodservice operators thanks to its ideal balance of capacity, clarity and cost-efficiency. Available in PET, PP and compostable PLA, these cups offer strong stacking, lid compatibility, and customizable options including colors, full-wrap printing and cold-branding to meet diverse market needs. Compliance with international food-contact standards, recyclable or compostable choices, and high optical clarity make them suitable for cold beverages, desserts and takeout lines worldwide. Our end-to-end sourcing solution simplifies procurement: rapid prototyping and sampling, flexible MOQs, scalable mass production, rigorous quality control and full packaging customization. We handle certification documentation, lab testing, warehousing and global logistics to ensure predictable lead times and on-time delivery. From product design to final shipment, the integrated approach reduces risk and cost while enabling brands and distributors to scale with confidence.
| Metric | Typical Value / Distribution | Notes (industry context) |
|---|---|---|
| Global annual demand (approx.) | ~52 billion units (2025 estimate) | Represents single-use rigid beverage cups by unit; 20 oz is among the largest single-size segments. |
| Share of single-use cup market (by units) | 20 oz: ~28% | Largest single-size segment in many markets due to fountain drinks and large servings. |
| Compound annual growth rate (CAGR) | ~3.2% (2024–2030, volume) | Gradual growth driven by foodservice recovery and event catering; growth tempered by sustainability shifts. |
| Material composition (typical by weight) | PP ~70% / PS ~25% / Other ~5% | Polypropylene (PP) increasingly favored for heat resistance and recyclability where PP streams exist. |
| Average weight per cup | ~9 g (typical thermoformed/injection cup) | Varies by wall thickness and reinforcement; lighter designs exist at ~6–7 g, heavy-duty at 10+ g. |
| Typical wall thickness | ~0.35 mm (range 0.25–0.60 mm) | Thinner walls lower material use but can affect rigidity for filled 20 oz servings. |
| Manufacturing methods (global split) | Injection molding ~60% / Thermoforming ~35% / Extrusion & other ~5% | Process choice driven by volume, tooling costs and desired cup geometry. |
| Units per pallet (typical stacked) | ~48,000 units per standard pallet (stacked) | Pallet counts vary by cup nesting height and packaging; common for bulk logistics planning. |
| Regional demand distribution | North America 35% / Asia Pacific 30% / Europe 25% / Latin America 6% / MEA 4% | Distribution reflects foodservice scale and single-use consumption patterns across regions. |
| End uses (primary) | Fountain/beverage chains, events & catering, quick-service restaurants, concessions | Large-volume beverage service and on-premise consumption are main drivers for 20 oz size. |
| Post-consumer recycling rate (cups) | ~22% (global average for rigid beverage cups) | Actual recycling highly dependent on local collection infrastructure and material sorting streams. |
| Adoption of compostable/biodegradable alternatives | ~8% (by units, 2024 est.) | Higher adoption in regulated municipalities and event-specific procurement; still a minority overall. |
| GHG footprint (approx.) | ~45 kg CO2e per 1,000 cups (life-cycle, cradle-to-grave) | Includes material production, forming, and typical end-of-life mix; reductions possible via recycled content. |
| Typical end-of-life pathways | Recycling (where available) / Energy recovery / Landfill | Collection and sorting constraints often determine the realized pathway in each market. |
Related Products




Plastic Cups 20 Oz Factory Delivers Unmatched Quality
Top Selling Products







- Related Blog
- Reviews
- Reviews
