




300ml Plastic Cups - China Manufacturer of Durable Cups
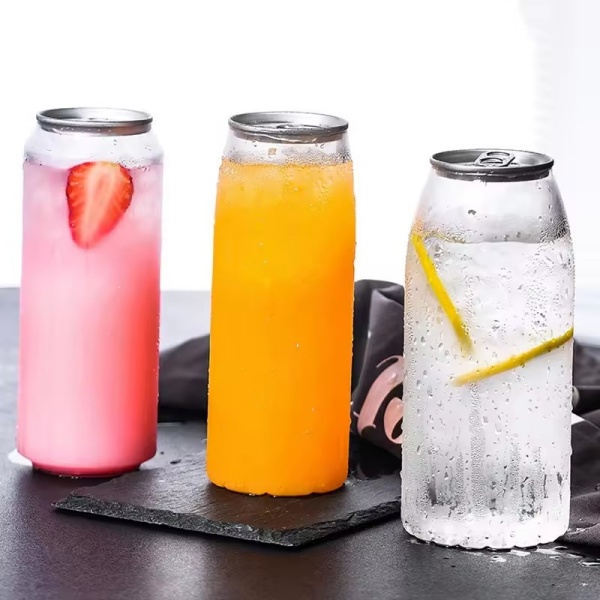
From a buyer’s point of view, reliability and price matter most when sourcing packaging. I’m a {China}-based {Manufacturer}, and I’m proud to offer {300ml Plastic Cups} that meet the daily demands of cafes, caterers, and wholesalers. These cups are food-grade, BPA-free, transparent, and designed for easy stacking without cracking. They work with standard lids, resist leaks, and perform well in both hot and cold beverages, making them ideal for events and take-away. We support flexible MOQs, private labeling, and quick lead times to match your schedule. Bulk shipments, consistent quality control, and responsive after-sales service are part of our promise. Whether you’re a distributor in China or abroad, you’ll find our pricing competitive and terms straightforward. I’m here to help you streamline procurement, reduce defects, and grow your beverage packaging business with a trusted partner.



300ml Plastic Cups For the Current Year Ahead of the Curve
The 300ml plastic cup is emerging as a must-have item for the year ahead, balancing convenience, presentation and cost-efficiency for cafes, caterers, retailers and event planners worldwide. Available in PET, PP and biodegradable PLA options, modern 300ml designs offer excellent clarity, stackability and lid compatibility, meeting food-safety standards and consumer demand for reusable-feel or compostable alternatives. Global buyers should prioritize partners who provide reliable production capacity, flexible MOQs, full customization (printing, color, barrier coatings) and documented compliance with international certifications. Streamlined logistics, transparent lead times and competitive pricing make it easy to scale seasonal or year-round programs while meeting sustainability goals—ensuring your beverage packaging stays ahead of the curve.
| Property | PET (typical) | PP (typical) | PS (typical) | Unit / Notes |
|---|---|---|---|---|
| Nominal capacity | 300 | 300 | 300 | ml |
| Top diameter (typical) | 94 | 92 | 93 | mm |
| Height (typical) | 110 | 108 | 109 | mm |
| Wall thickness (nominal) | 0.20–0.35 | 0.18–0.30 | 0.18–0.30 | mm |
| Tare weight (typical) | ~10 | ~8 | ~7.5 | g (single empty cup) |
| Material density | 1.38 | 0.90 | 1.05 | g/cm³ |
| Resin identification code | 1 | 5 | 6 | recycling code |
| Use temperature range (typical) | -20 to 60 | -20 to 120 | -10 to 70 | °C; depends on wall thickness |
| Microwave-safe (typical) | No | Often yes (depending on grade) | No | qualitative |
| Tensile yield strength (typical) | 55–75 | 30–40 | 40–60 | MPa (per ISO/ASTM tensile tests) |
| Estimated cradle-to-gate GHG | ~30 | ~18 | ~20 | g CO2e per cup (est.; depends on resin source & processing) |
| Recyclability (common) | Widely recyclable via bottle/cup streams | Growing recyclability; varies by region | Limited recycling access; more niche streams | qualitative |
| Compostability | Not compostable | Not compostable | Not compostable | industrial composting not applicable |
| Production tolerance (typical) | ±2–4% | ±2–4% | ±2–5% | dimensional / capacity variation |
| Common applications | Cold beverages, iced drinks, single-use cold food | Hot/cold beverages, microwaveable portions (grade-dependent) | Cold beverages, portion trays, deli salads | qualitative |
| Stackability (nested) | ~60 | ~70 | ~65 | cups per nested column (approx.) |
| Shelf life (empty, dry storage) | Indefinite; recommend 3–5 years to avoid UV/oxidative effects | Indefinite; recommend 3–5 years to avoid UV degradation | Indefinite; recommend 3–5 years to avoid embrittlement | qualitative |
| Typical test standards referenced | ISO 527, ASTM D792, ASTM D1238 | ISO 527, ASTM D792, ASTM D1238 | ISO 527, ASTM D792 | standards for mechanical/density/MFI |
| Leak resistance (qualitative) | Good for upright cold liquids with compatible lids | Good; better for hot liquids when designed for lids | Moderate; better for cold liquids | qualitative |
Related Products


300ml Plastic Cups Manufacturer Products
Top Selling Products






- Related Blog
- Reviews
- Reviews
