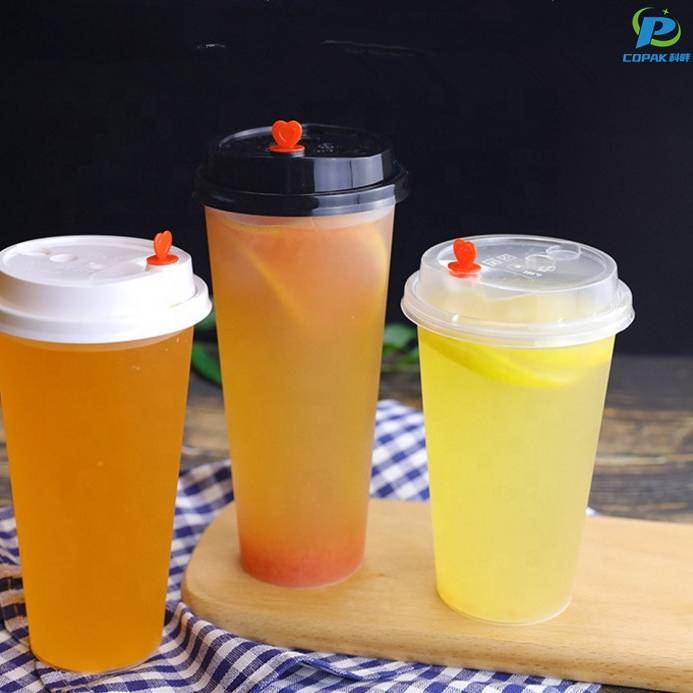
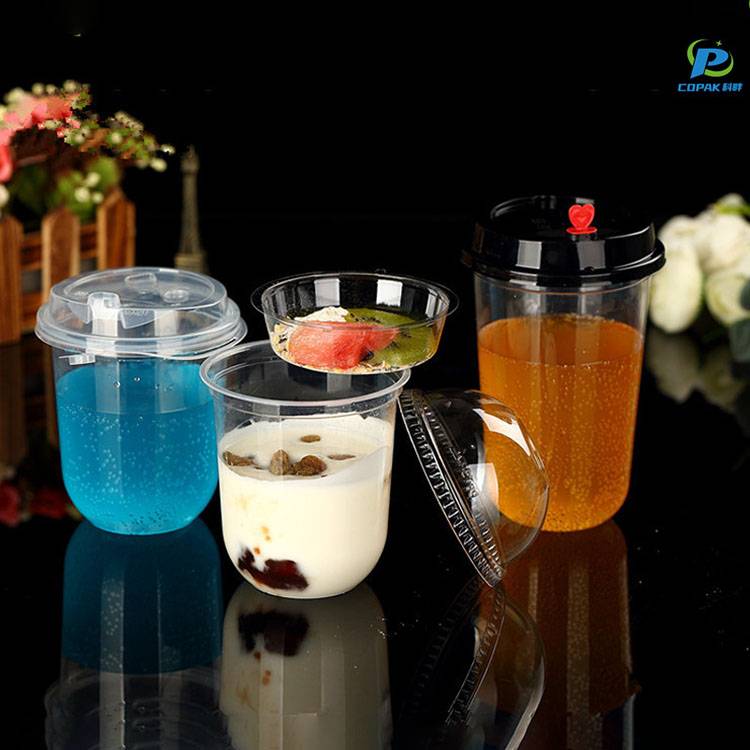
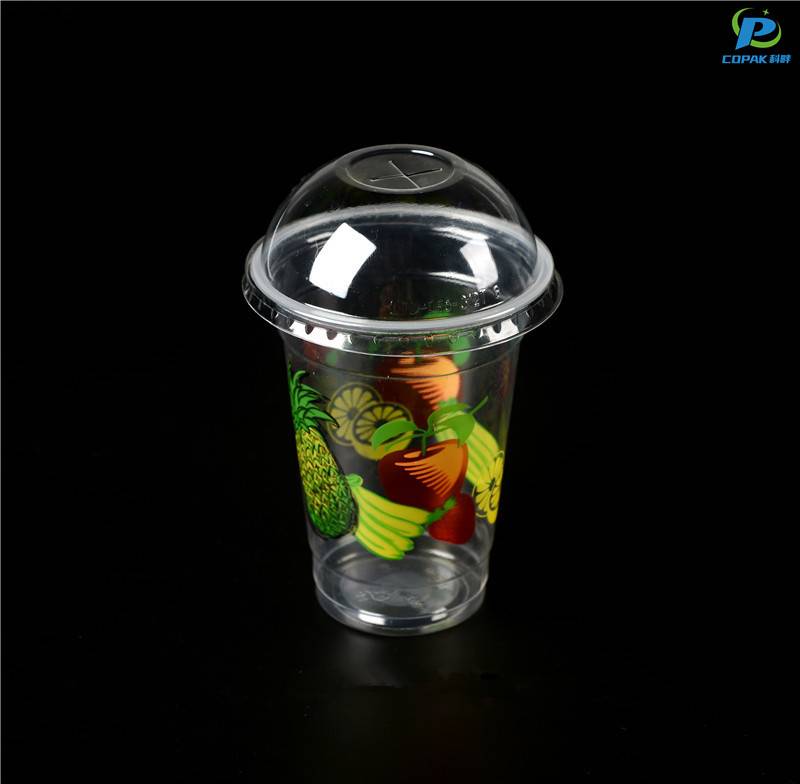
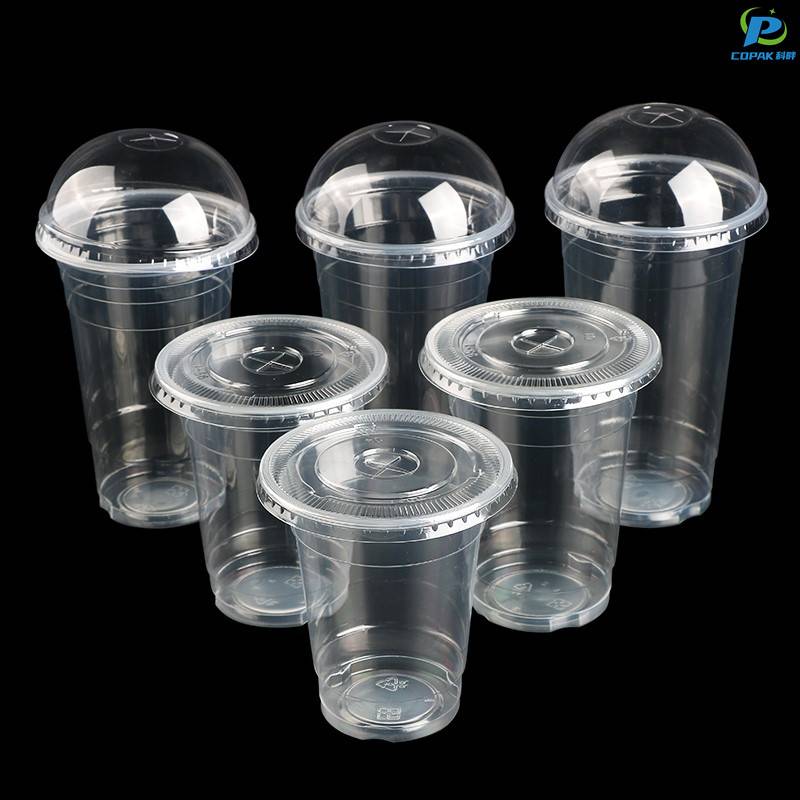
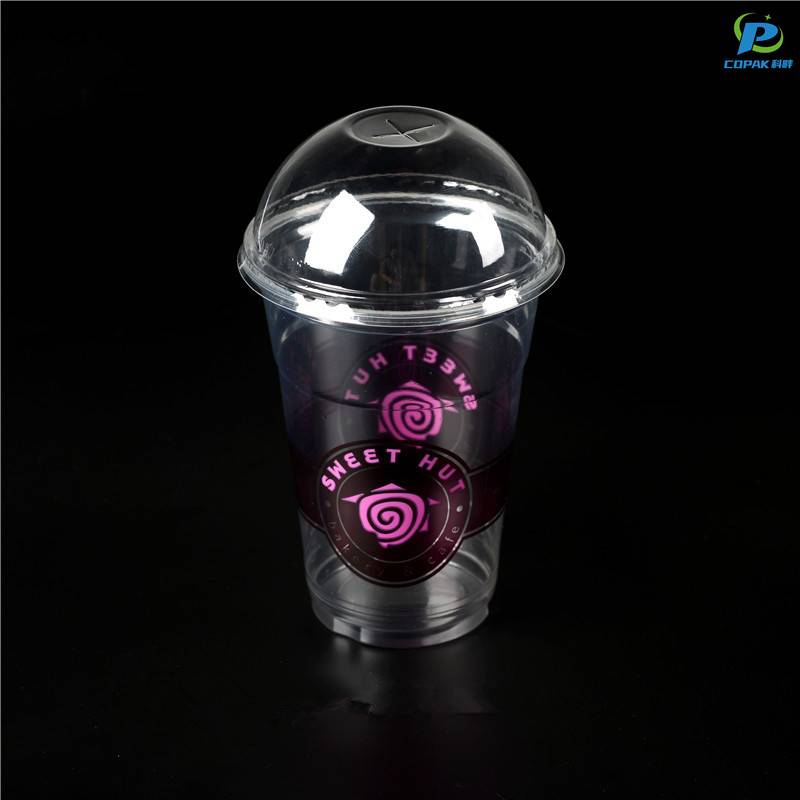
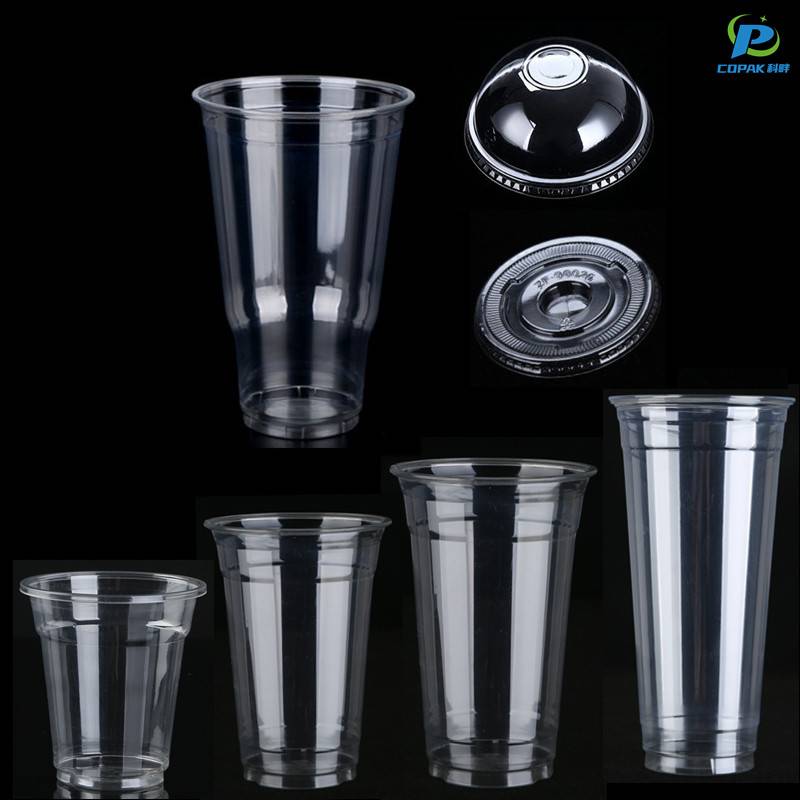
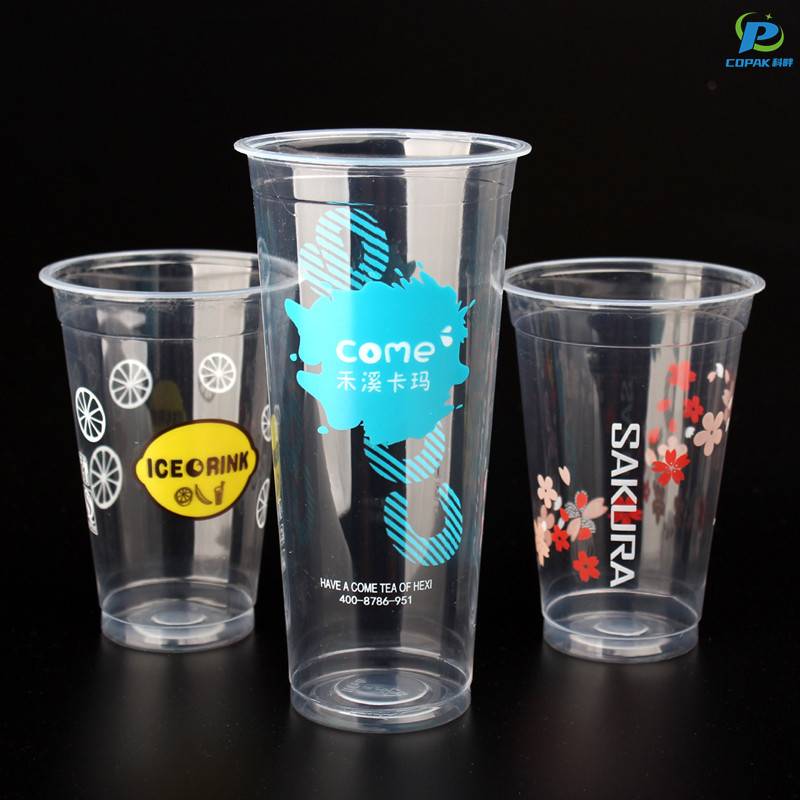
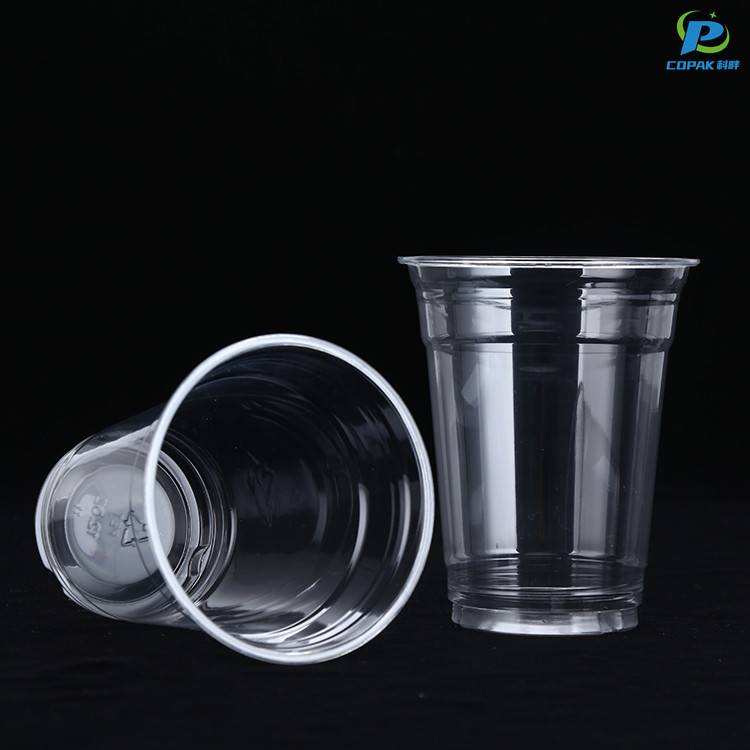
I craft Printed PET Cups that bring clarity and reliability to your brand packaging. As a China-based Manufacturer, I understand what B2B buyers look for: durable material, vibrant prints, and fast, scalable service. My cups use food-grade PET, BPA-free, with heat tolerance and leak resistance for hot or cold drinks. The print area is designed for sharp, full-color branding, from logos to multi-color campaigns, with consistent color fidelity across large runs. I offer flexible MOQ, rapid prototyping, and turnkey support—from artwork check to production and packaging. With tight quality controls, you’ll notice uniform thickness, smooth rims, and high stacking efficiency that speed up your logistics. I can customize sizes, lid compatibility, and printing on demand to fit your seasonal promotions or year-round product lines. If you’re seeking a reliable supplier in China, I’m ready to collaborate on OEM projects, offer competitive pricing, and deliver on-time shipments that keep your customers loyal.
Printed PET cups dominate global beverage and retail packaging because they combine crystal-clear presentation with exceptional strength and light weight, making products look premium while cutting transport costs. Their food-safe, BPA-free composition and excellent barrier properties suit cold drinks, desserts and promotional items; full-color printing, embossing or matte finishes deliver vivid branding that stands out on crowded shelves. Custom sizes, stackable designs and lid compatibility add practical value for retail, foodservice and events. For global buyers seeking reliable partners, printed PET cups offer fast, scalable production with consistent quality and competitive pricing. Modern manufacturing supports low minimum orders, quick samples and flexible OEM/ODM services while meeting international safety and recycling standards. With optimized packaging and logistics options, these cups provide a sustainable, cost-effective way to elevate products and accelerate market entry worldwide.
| Variant | Material | Capacity (ml) | Wall Thickness (μm) | Weight (g) | Printing Method | Max Print Colors | Recommended Resolution (dpi) | Food Contact Compliance | Recyclability (%) | PCR Content (%) | Typical Use Case | Thermal Resistance (°C) | Shelf Life (months) | Estimated CO2 per Cup (g) |
|---|---|---|---|---|---|---|---|---|---|---|---|---|---|---|
| Variant 1 | PET (clear) | 200 | 190 | 6 | Rotogravure | 6 | 300 | FDA & EFSA compliant | 92 | 0 | Cold beverages, sampling cups | 60 | 24 | 20 |
| Variant 2 | PET (clear) | 250 | 210 | 7 | Flexographic (water-based) | 6 | 300 | FDA & EFSA compliant | 88 | 10 | Iced drinks, event catering | 65 | 24 | 24 |
| Variant 3 | PET (lightly tinted) | 330 | 260 | 9 | Digital UV | 8 | 600 | FDA & EFSA compliant | 80 | 15 | Fountain drinks, promotional cups | 70 | 18 | 30 |
| Variant 4 | PET (matte finish) | 420 | 300 | 11 | Offset / Litho | 8 | 300 | FDA & EFSA compliant | 75 | 20 | Smoothies, takeout combos | 75 | 18 | 36 |
| Variant 5 | PET (opaque white) | 500 | 350 | 13 | Flexo + Protective Varnish | 6 | 300 | FDA & EFSA compliant | 70 | 25 | Cold brew, iced coffee cups | 80 | 12 | 45 |
| Variant 6 | PET (reinforced) | 700 | 400 | 18 | Digital UV (high-res) | 8 | 600 | FDA & EFSA compliant | 65 | 30 | Large fountain cups & shared beverages | 85 | 12 | 60 |