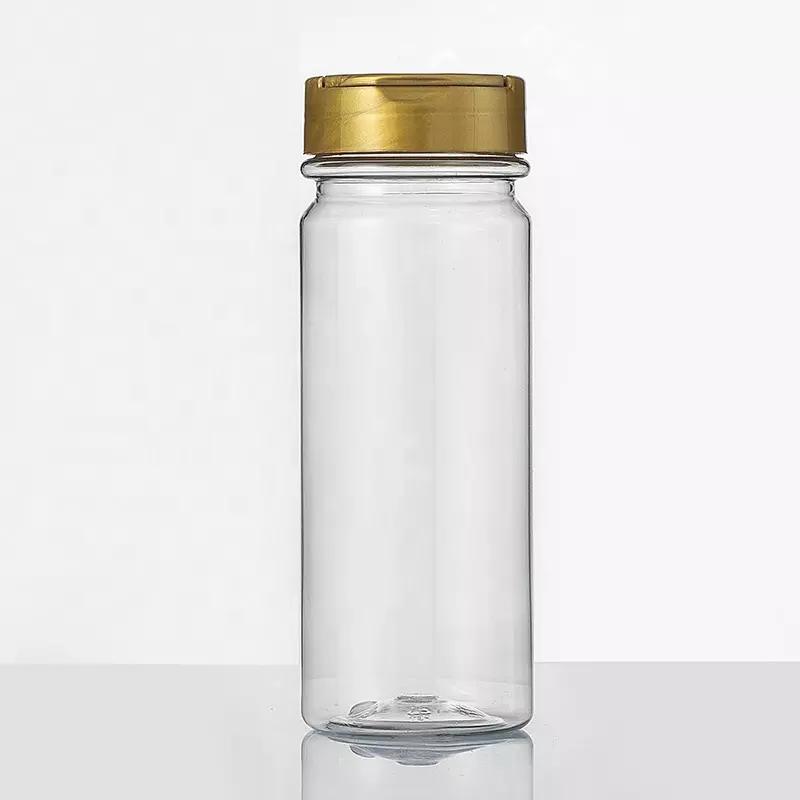
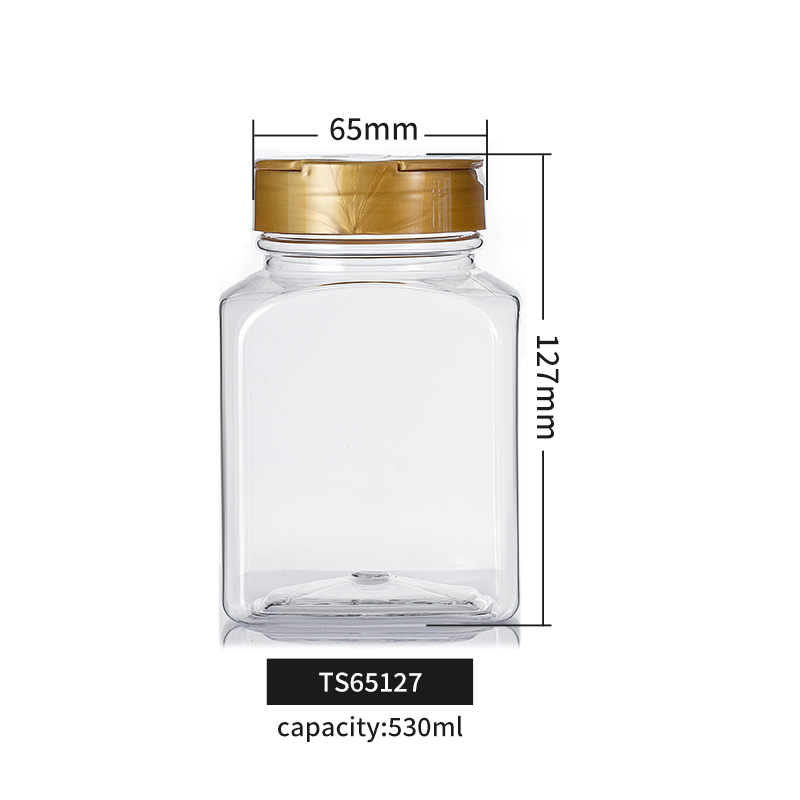
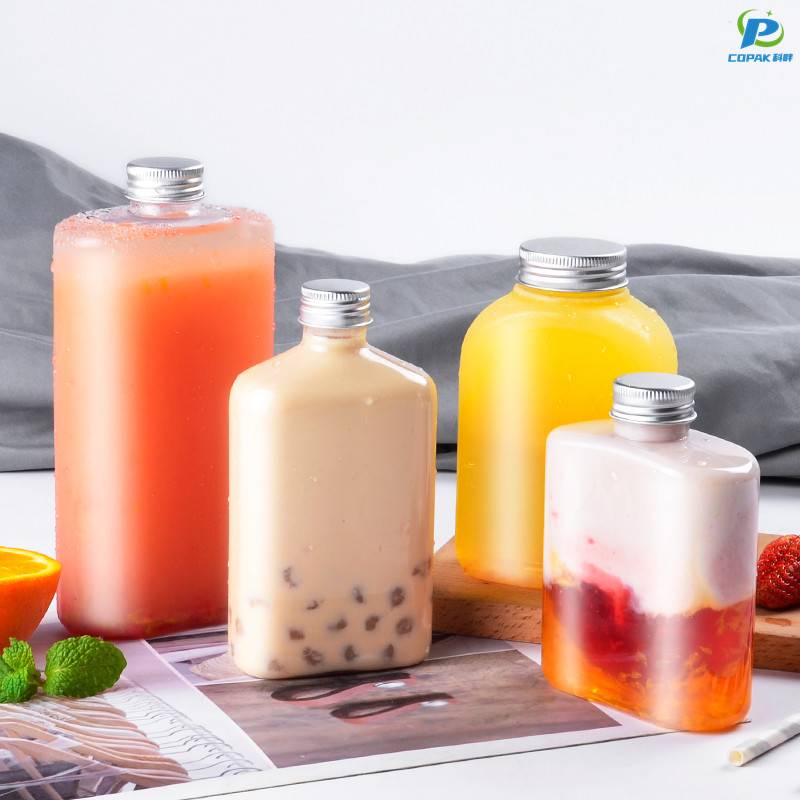
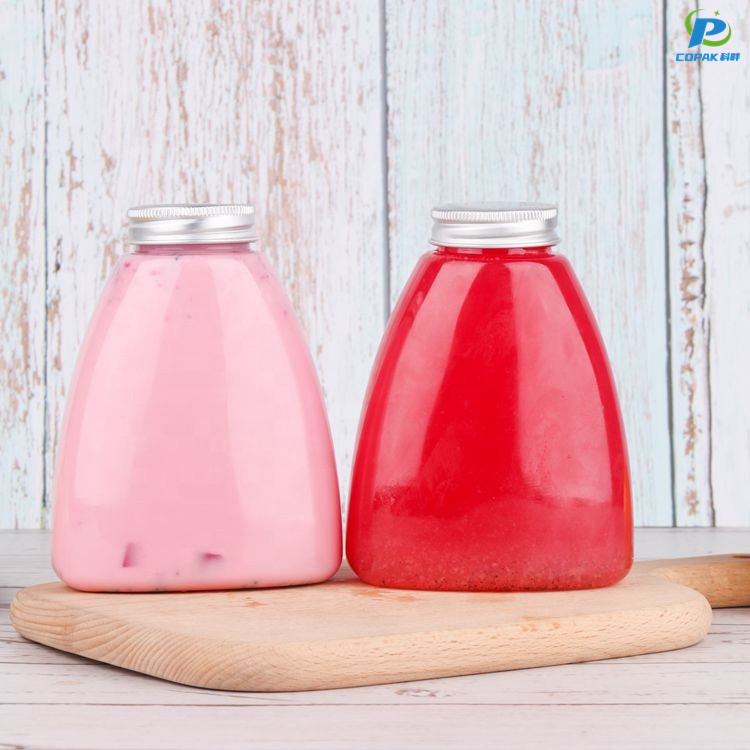
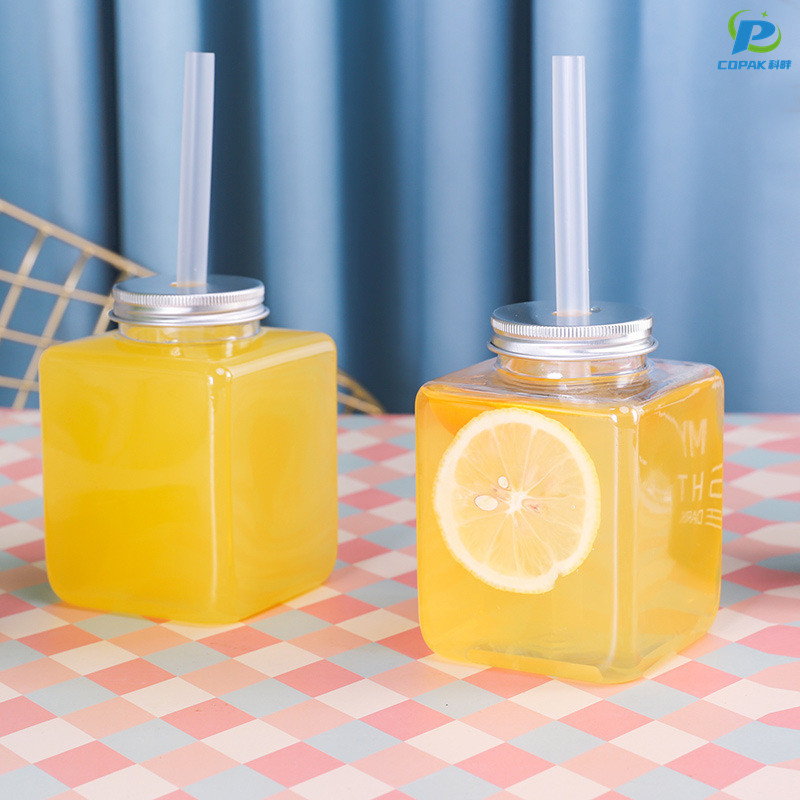
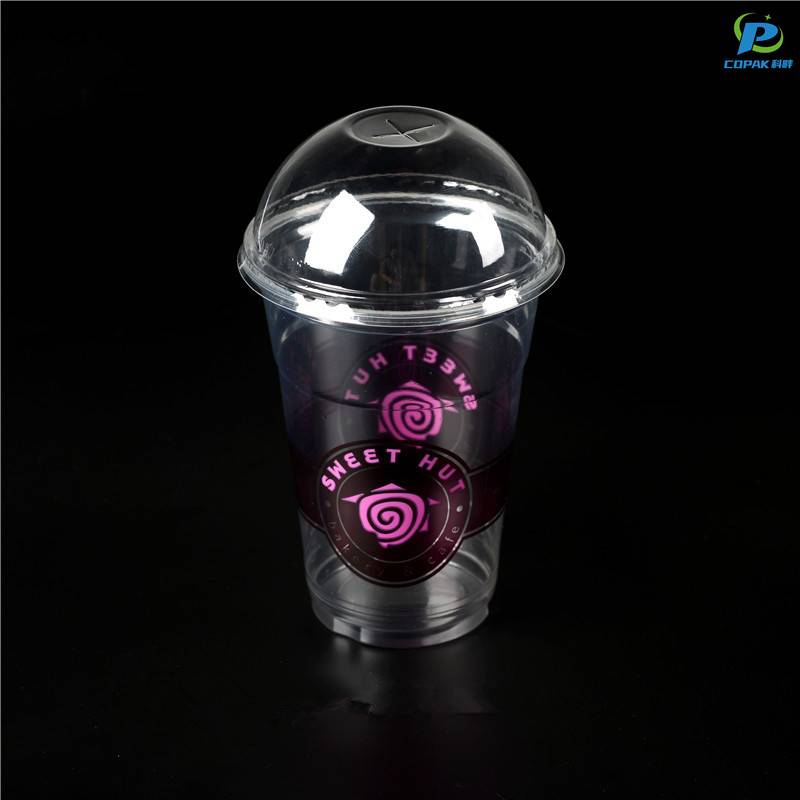
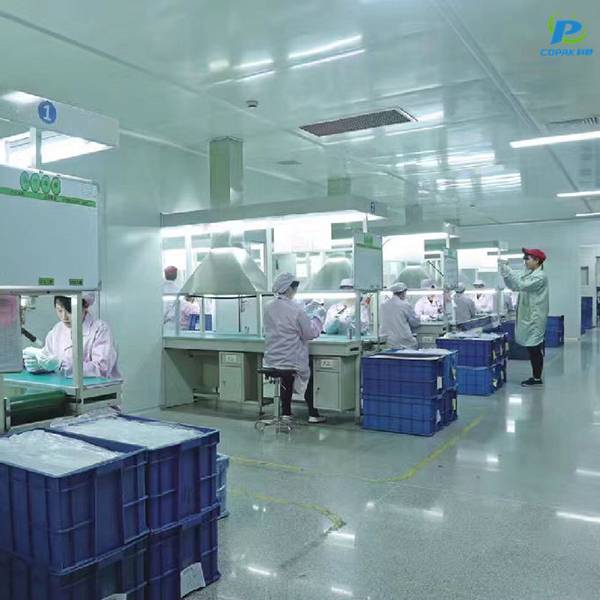
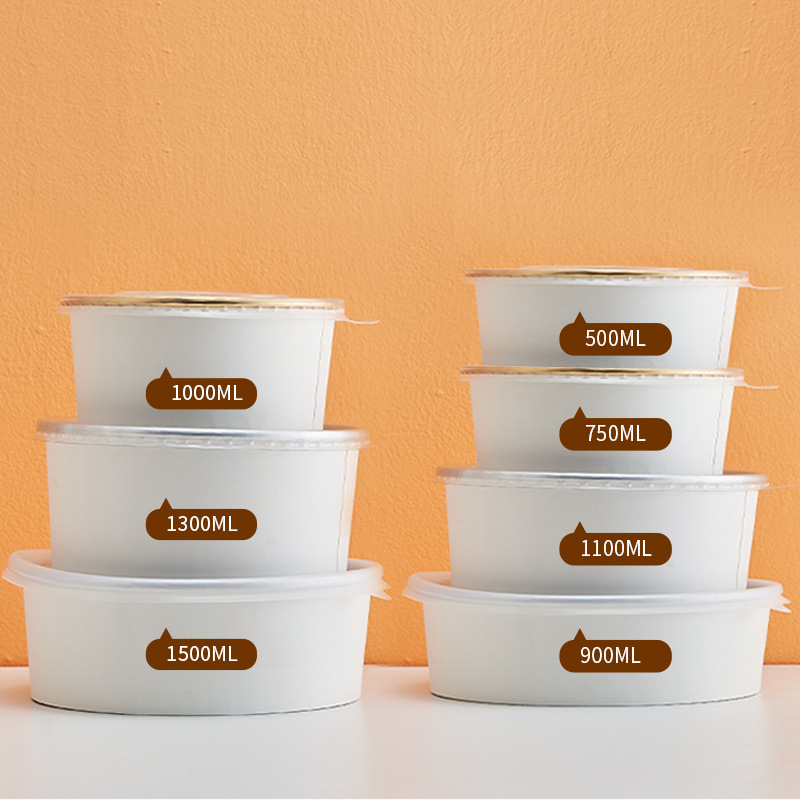
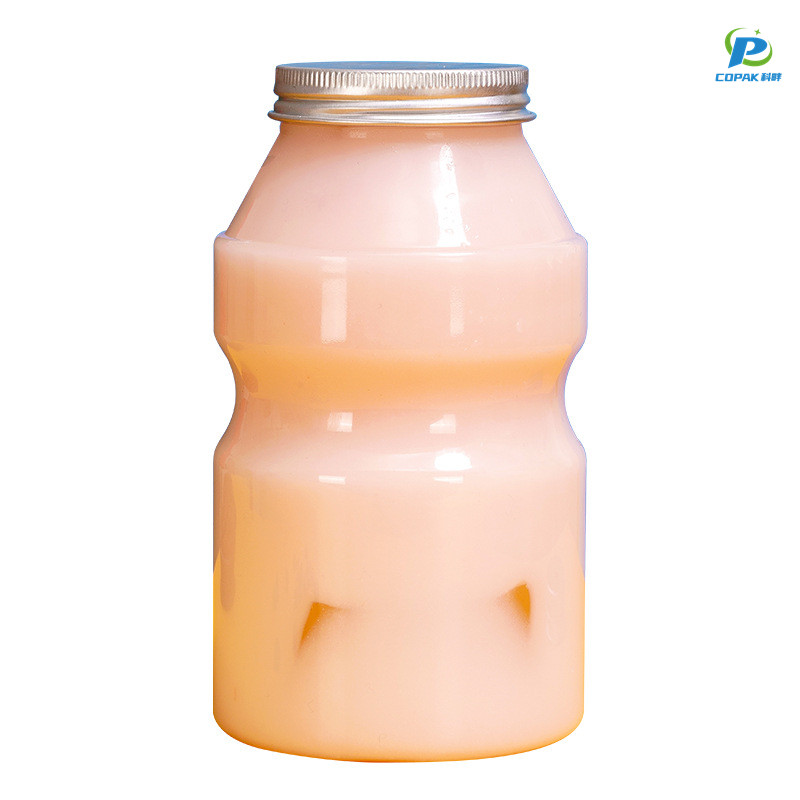
As a China-based manufacturer, I deliver RPET Bottles that meet the exacting needs of bulk packaging buyers. Made from recycled PET, these bottles help you cut waste and reduce costs without sacrificing performance. I offer a broad range of sizes, from small 30 ml samples to 1 L family bottles, with various neck finishes and closures to fit your cap designs. Our production runs scale with demand and we can customize labeling, printing, and color options for your brand. We ship efficiently to China and international markets, with short lead times and strict quality control to ensure consistency batch after batch. You’ll appreciate clear, consistent wall thickness and good drop resistance, ideal for beverages, cosmetics, or household products. If you’re looking for a reliable, transparent partnership with a proven Manufacturer in China, I’m ready to discuss MOQ, pricing, and timelines. Let’s build your sustainable pipeline with RPET Bottles.
RPET bottles are setting the pace in the global packaging market this year, driven by rising regulatory pressure, brand sustainability commitments, and consumer demand for circular materials. For global buyers, RPET offers a compelling mix of lower carbon footprint, consistent mechanical performance, and full recyclability compared with virgin PET. Advances in sorting and washing technologies mean higher clear-content rPET, improved barrier options, and compatibility with standard filling lines—making transition seamless for beverage, personal care, and food manufacturers. As an experienced manufacturer and exporter, we deliver scalable production, strict quality control, and customizable design options (neck finish, volume, color, and decoration) to meet diverse market requirements. Our supply chain capabilities support reliable lead times, international certifications, and optimized logistics to minimize costs and carbon emissions. Partnering with a supplier focused on traceable recycled content and regulatory compliance helps procurement teams meet sustainability goals without sacrificing performance or budget.
| Region | Estimated rPET Bottles Production (kt) | Market Share (%) | 5-Year CAGR (2021–2026) (%) | Estimated Bottle Recycling Rate (%) | Average rPET per Bottle (g) | Regulatory Impact | Key Drivers |
|---|---|---|---|---|---|---|---|
| Asia-Pacific | 6,400 | 49.2% | 7.2% | 33% | 6 g | Moderate‑High (expanding mandates) | Growing collection infrastructure; beverage sector commitments; rising consumer demand |
| Europe | 3,200 | 24.6% | 5.0% | 58% | 12 g | High (mandates and recycled content targets) | Strong EPR frameworks; advanced collection and sorting; binding recycled content targets |
| North America | 2,100 | 16.2% | 4.5% | 36% | 8 g | Moderate (state-level mandates) | State policies; investment in recycling tech; consumer preference for recycled packaging |
| Latin America | 700 | 5.4% | 6.8% | 22% | 4 g | Moderate (growing EPR) | Expanding collection programs; public-private partnerships; consumer awareness campaigns |
| Middle East & Africa | 600 | 4.6% | 7.5% | 12% | 3 g | Low‑Moderate (pilot programs) | Pilot collection systems; nascent recycling investments; regulatory pilots |
| Global Total | 13,000 | 100% | 6.2% | 36% | 7 g | Moderate‑High | Global policy alignment, scaling of collection and recycling technologies, corporate commitments to circularity |