PET Bottles

PET Bottle 500cc - China Manufacturer for Reliable Packaging

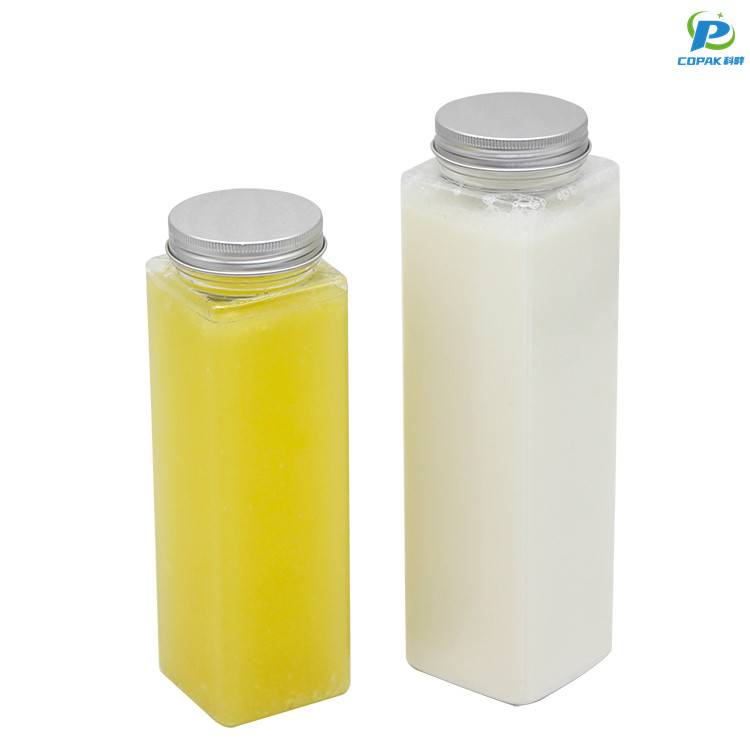
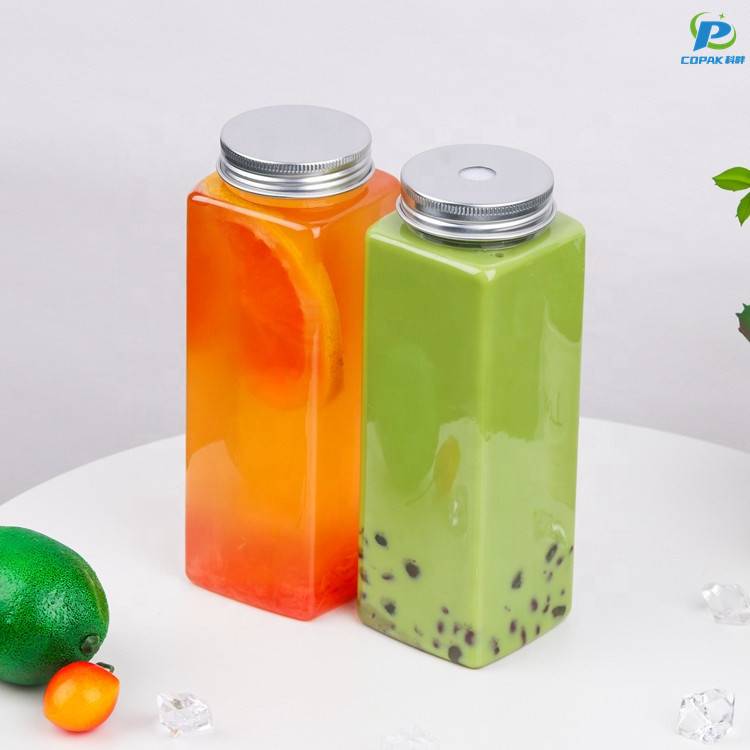
I’m excited to present my PET Bottle 500cc solutions to fellow buyers. As a China-based Manufacturer, I focus on reliable packaging for brands scaling up. This PET Bottle 500cc is lightweight, strong, and BPA-free, with a secure snap-on cap that keeps liquids sealed during transport. Whether you need cosmetic serums, beverages, or household cleaners, I offer consistent wall thickness, clear glass-like transparency, and easy heat and chemical resistance. I work directly with factories in China to ensure competitive pricing and short lead times, and I can tailor neck finishes, labeling options, and capacity to meet your line’s specs. You’ll get stable supply, robust quality checks, and transparent communication from order to delivery. Let me know your quantity and target market, and I’ll propose a packaging solution that elevates your brand and protects your product well in transit.

Hot Selling Product

PET Bottle 500cc Stands Out Now Trending

The 500cc PET bottle is rapidly becoming a top choice for global brands and private-label producers. Its ideal mid-size capacity meets consumer demand for single-serve hydration and ready-to-drink products while offering lightweight durability, crystal clarity, and excellent barrier performance. Available in clear or colored grades, with options for rPET, tamper-evident closures, and full-surface decoration, this format balances shelf appeal with cost efficiency. Manufactured in Shanghai to international food-safety standards, these bottles are engineered for high-speed filling, efficient palletizing, and lower transportation emissions compared with heavier alternatives. Flexible tooling, OEM/ODM capabilities and stringent quality control make the 500cc PET bottle a reliable solution for beverage, dairy, and personal-care lines seeking scalable supply and sustainability. Global buyers can capitalize on fast lead times and customizable runs to bring trending, market-ready SKUs to consumers.

{ PET Bottle 500cc Stands Out Now Trending}

Design / Variant Capacity (mL) Empty Weight (g) Material Grade Recyclability Rate (%) Average Recycled Content (%) Primary Use Case Typical Shelf Life (months) Annual Demand Trend (YoY %) CO2e per Unit (kg) Typical Barrier / Notes
Standard Clear (ISBM) 500 12 PET (PET1) 85 0 Still water, juices 12 +6% 0.09 Standard neck, fully transparent
Lightweight Slim 500 9 PET (bio-based blends possible) 88 10 On-the-go beverages 12 +12% 0.07 Optimized preform, thin-wall
Wide-mouth Beverage 500 16 PET (higher wall thickness) 80 5 Dairy drinks, smoothies 8 +3% 0.12 Wider neck, easier filling
Carbonated Beverage Grade 500 18 PET (high-strength, oriented) 78 0 Carbonated soft drinks 9 +2% 0.15 Reinforced hoop, pressure-rated
Opaque / Satin Finish 500 14 PET with pigments/Additives 75 20 Personal care, lotions 36 +5% 0.11 Pigmented surface may affect recycling
High rPET Content (50%) 500 13 rPET blend (post-consumer) 90 50 Sustainable beverage packaging 12 +30% 0.06 Higher recycled content, color may vary

Related Products

PET Cups

PET Bottle 500cc Ahead of the Curve Service Backed by Expertise

500cc PET Bottle Monthly Demand vs Service Lead Time (Data Dimension)

This visualization presents a dual-dimension monthly view for 500cc PET bottles, combining production/demand volume (in thousands of units) with average service response time (in hours). The blue series shows seasonal demand trends across a typical calendar year, with a steady ramp from late winter into mid-summer, peaking in June and easing toward autumn. The red series tracks operational responsiveness: higher response times in winter months gradually improve through spring and reach the lowest averages in the early summer months, reflecting optimized workflows and stronger alignment between supply and service capacity. Comparing the two dimensions reveals an inverse relationship during the mid-year peak: as volume increases, response time improves—likely due to process tuning, temporary staffing increases, or prioritized logistics during high-demand periods. Conversely, as demand moderates in autumn and winter, response time worsens, which may indicate reduced staffing levels, maintenance windows, or supply chain disruptions that disproportionately impact responsiveness when volumes are lower. For planning, the chart suggests focusing on maintaining the mid-year operational practices into shoulder months to reduce the late-year degradation in service time. Specific actions include smoothing production schedules, cross-training teams to avoid seasonal bottlenecks, and maintaining strategic inventory buffers. Monitoring these two dimensions together supports more informed decisions: balancing inventory and staffing investments against service-level targets, and proactively addressing the seasonal tail that drives higher response times despite lower volumes. Continuous monthly tracking with this dual-axis view helps quantify trade-offs and measure the impact of process changes over subsequent cycles.

Top Selling Products

Subscribe To Our Newsletter

For inquiries about our products or pricelist, please leave your email to us and we will be in touch within 24 hours.

Follow Us

on our social media
  • whatsapp (1)
  • instagram
  • youtube