




Clear Cups Plastic - China Manufacturer | Durable Disposable Cups
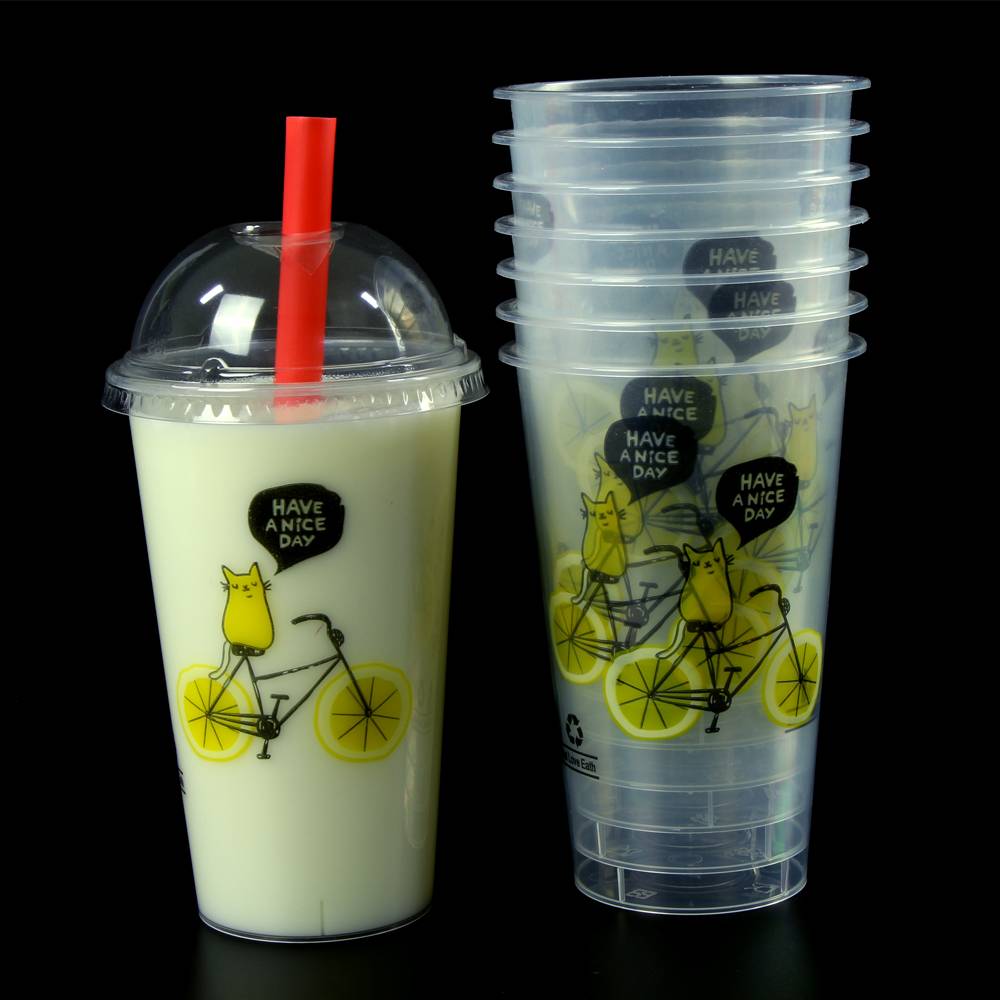
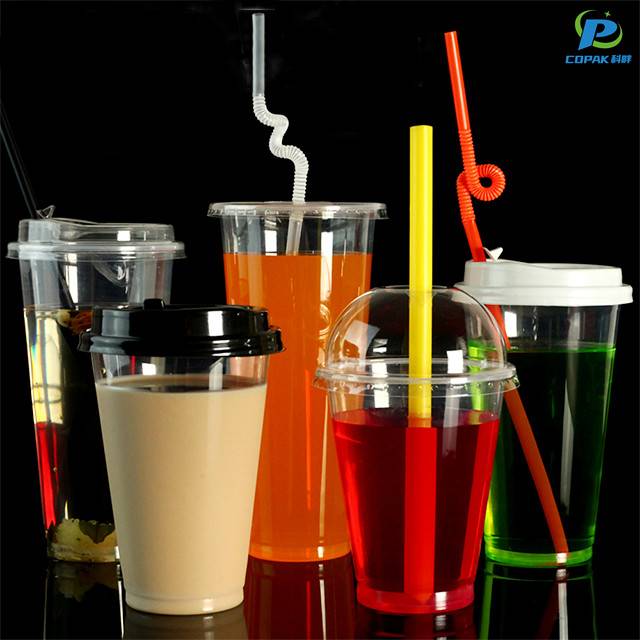
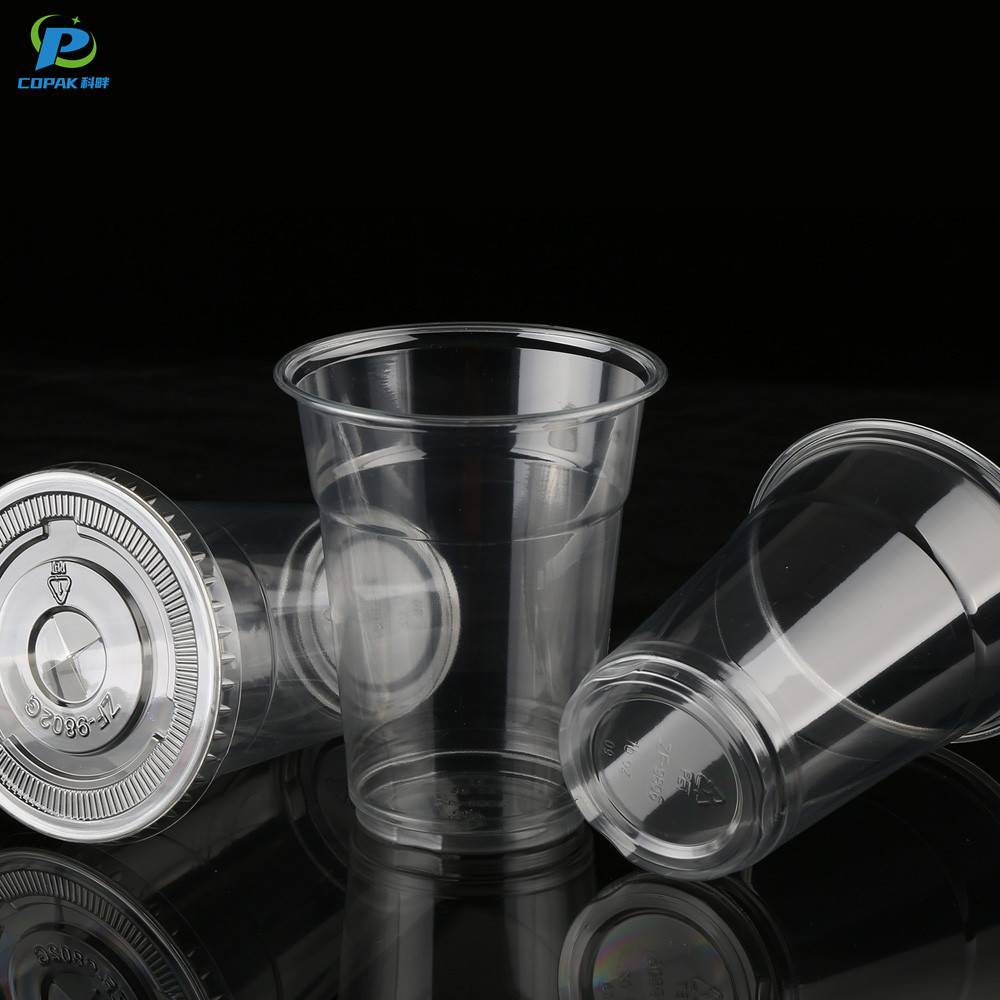
From my warehouse and production line in China, I offer Clear Cups Plastic that stand up to busy service and long shipments. As a Manufacturer, I understand what B2B buyers need: consistent clarity, sturdy construction, and reliable supply. These cups are food-grade PET, BPA-free, with crystal-clear clarity, leak-resistant lids, and smooth rims; they stack well for transport. Available in sizes 4 oz, 6 oz, 8 oz, 12 oz, 16 oz, with transparent lids and optional sleeves. I can customize print labels up to X colors, and provide OEM packaging to match your brand. Fast lead times, bulk pricing, stable supply, and ship from China to global destinations. Certifications available on request. If you are looking for a dependable China manufacturer of Clear Cups Plastic to support your food-service or beverage line, I’m ready to talk specs, MOQ, and delivery schedules.



Clear Cups Plastic Application in 2025
Clear plastic cups in 2025 combine crystal clarity with smarter material choices: high-clarity PET and rPET for recyclability, PLA blends for compostable solutions, and advanced PP options for heat-resistant uses. Design trends favor lightweighting, anti-fog and anti-scratch finishes, dual-wall insulation for premium cold drinks, integrated lids and strawless variants, plus barrier coatings for extended freshness — all tailored for cafes, beverage chains, delivery and e-commerce packaging. Global buyers should prioritize suppliers offering verified PCR content, FDA/EU food-contact compliance, full traceability and robust QC testing (impact, clarity, migration). Flexible tooling, short lead times, scalable MOQ, and value-added services (custom printing, packing formats, drop-shipment) are key to balancing cost and sustainability goals. Choosing partners that blend transparent sourcing with certification and responsive logistics ensures competitive supply in 2025’s fast-moving beverage and retail markets.
| Application Sector | Typical Clear Plastic Type | Estimated Share of Clear Cup Usage (2025) | Common Use Cases | Recyclability / End‑of‑Life (2025) | Avg Service Temp (approx.) | Regulatory / Compliance Notes | Expected CAGR (2025–2030) |
|---|---|---|---|---|---|---|---|
| Foodservice (single‑use beverages) | PET (clear), PS (crystal) in some regions | 45% | Cold drinks, smoothies, iced coffee, fountain beverages | PET: widely accepted where bottle collections exist; PS: low municipal recycling acceptance | 0–60°C | Increasing single‑use plastic restrictions in many jurisdictions; phasing of PS in some markets | -1.0% |
| Retail Packaged Beverages | PET (clear) predominates | 20% | Cold ready‑to‑drink beverages, multipack clear cup packaging | High recyclability where bottle collection and sorting exist; widely recyclable resin code 1 | 0–60°C | Design-for-recycling initiatives; lightweighting trends | +0.8% |
| Events & Catering | PET and increasingly PLA/CPLA for compostable options | 10% | Temporary bars, festivals, corporate events, trade shows | Mixed: PET recyclable in many systems; compostables require industrial composting and proper collection | 0–60°C | Event organizers adopting compostable options where organics collection exists; bans on oxo‑degradable materials | +0.5% |
| Food Delivery / Takeaway | PET, PP where higher heat resistance required; PLA in some regions | 8% | Cold drinks, salads, milkshakes provided with delivery or takeaway | Recycling depends on contamination and local sorting; compostable uptake limited by infrastructure | 0–80°C (PP variants for hot takeaways) | Push for reusable systems and deposit-return pilots in some urban areas | +1.2% |
| Institutional (schools, hospitals) | PET, PP; increased interest in reusable or sterilizable solutions | 7% | Meal programs, cafeterias, controlled catering | Controlled waste streams allow some recycling; medical/regulated waste rules may require incineration | 0–100°C (PP used for higher temps) | Procurement policies can favour reusable or certified compostable materials where infrastructure exists | -0.3% |
| Vending & Concessions | PET and clear PP blends | 5% | Dispensed soft drinks, prepackaged cold drinks at venues | Often collected via venue recycling programs; contamination can reduce yield | 0–60°C | Venue-level bans on single-use plastics and deployment of cup-return systems in some large arenas | +0.5% |
| Other (promotions, retail samples) | PET, small volumes of PS and compostables | 5% | Promotional samples, point‑of‑sale dispensing | Mixed; small quantities can be challenging to collect for recycling | 0–60°C | Regulations on single‑use promotion materials in some regions | +0.2% |
Related Products



Clear Cups Plastic Is The Best Industry Giant
Top Selling Products




- Related Blog
- Reviews
- Reviews
