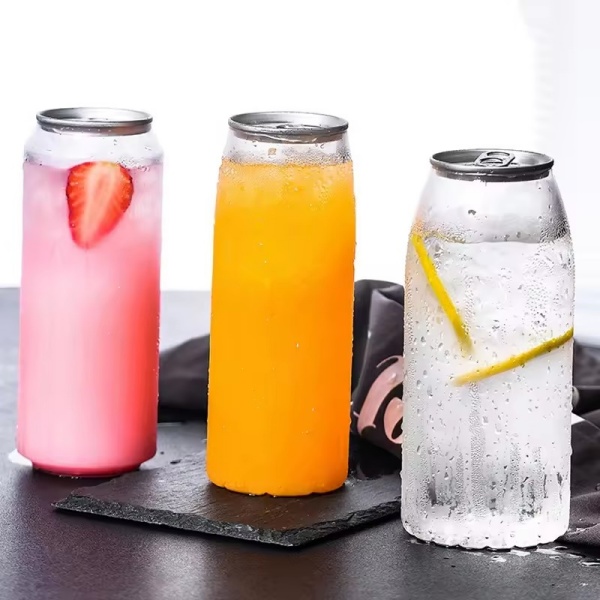
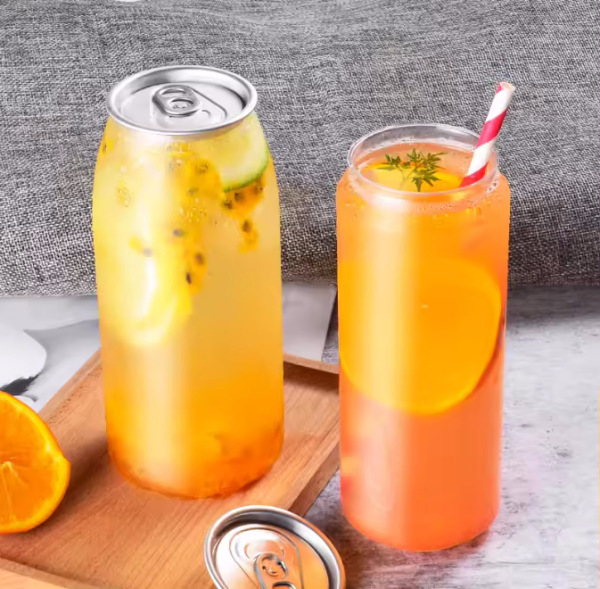
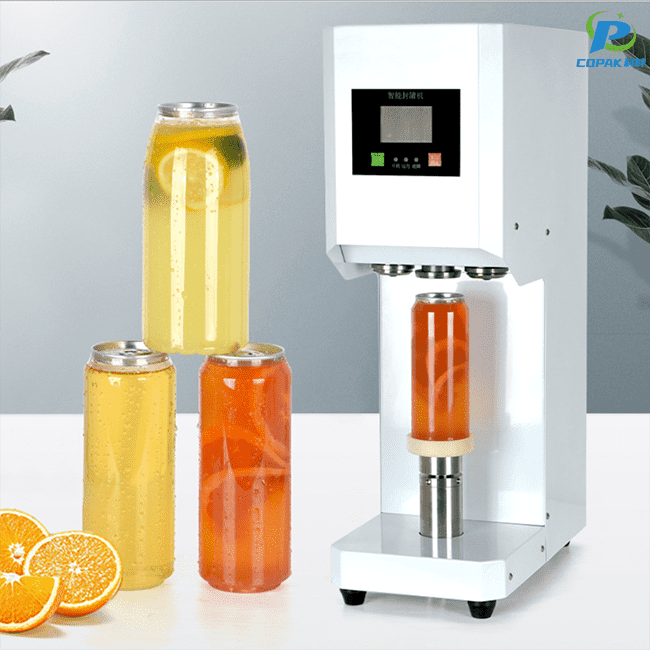
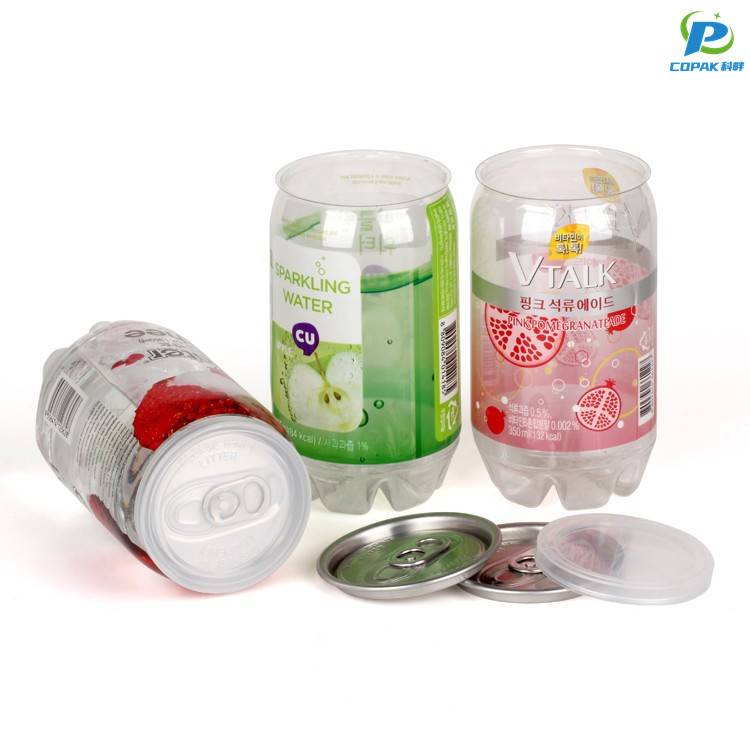
From the factory floor in China, I supply CANS PET Soda Cans that meet the stringent needs of global brands. I am a China Manufacturer focusing on safe, lightweight packaging solutions for soft drink, tea, and energy drink lines. Our CANS PET Soda Cans combine high clarity PET shells with sturdy aluminum ends for reliable sealing and efficient recycling. I offer customizable options: sizes from 250 ml to 550 ml, tamper-evident lids, printed labels, and surface finishes that resist oil and carbonation. With food-grade materials approved by relevant authorities, these cans preserve taste and carbonation for longer shelf life. I can support flexible MOQs, rapid lead times, and private-label branding, enabling seamless integration with your supply chain. From packaging design to final shipment, I handle quality control at every step. If you’re sourcing PET can solutions in China or seeking a dependable Manufacturer partner, I’m ready to discuss your specs, volumes, and certification needs today.
Global beverage producers demand packaging that delivers durability, shelf appeal and line efficiency. Our PET soda cans feature precision-engineered wall profiles, optimized neck finishes and high-barrier coatings to ensure consistent carbonation retention, perfect labeling surfaces and seamless compatibility with high-speed filling and sealing equipment. Rigorous in-line and lab testing plus ISO-standard quality control guarantee on-time, defect-free delivery at scale. Sustainability and flexibility go hand in hand: lightweight constructions reduce transport emissions, PCR options and fully recyclable materials support circular-economy goals, and customizable sizes, finishes and print capabilities enable brand differentiation. With dedicated technical support, rapid prototyping and responsive global logistics, buyers secure a partner committed to peak end-to-end packaging performance.
| Production Line | Container Type | Daily Throughput (units/day) | Cycle Time (s/unit) | OEE (%) | Reject Rate (%) | Fill Accuracy (±ml) | Material Gauge (mm) / Preform (g) | Energy (kWh/1000) | CO₂ (kg/1000) | Water (L/1000) | Maintenance Interval (hrs) | Last Downtime (hrs) | Quality Score |
|---|---|---|---|---|---|---|---|---|---|---|---|---|---|
| Line A1 | PET Bottle 330 ml | 1,200,000 | 0.072 | 92 | 0.45 | ±1.5 | — / 24 | 18 | 2.8 | 12 | 1200 | 2.0 | 96 |
| Line B2 | Aluminum Can 330 ml | 2,400,000 | 0.036 | 95 | 0.25 | ±1.0 | 0.210 / — | 6 | 1.1 | 3 | 1600 | 1.5 | 98 |
| Line C3 | PET Bottle 500 ml | 900,000 | 0.096 | 89 | 0.80 | ±3.0 | — / 27 | 20 | 3.6 | 15 | 1000 | 6.0 | 92 |
| Line D4 | Aluminum Can 330 ml Slim | 1,800,000 | 0.048 | 90 | 0.40 | ±1.2 | 0.200 / — | 5.5 | 1.0 | 3.5 | 1400 | 0.5 | 95 |
| Line E5 | PET Bottle 250 ml | 750,000 | 0.115 | 85 | 1.20 | ±2.0 | — / 22 | 17 | 2.5 | 10 | 900 | 12.0 | 88 |
| Line F6 | Aluminum Can 500 ml | 600,000 | 0.144 | 87 | 0.70 | ±1.8 | 0.230 / — | 8 | 1.5 | 4 | 1100 | 3.0 | 90 |
| Line G7 | PET Bottle 1.0 L | 400,000 | 0.216 | 82 | 1.60 | ±4.0 | — / 35 | 25 | 4.0 | 22 | 800 | 8.0 | 85 |
| Line H8 | Hybrid (Can + PET Flex) | 1,000,000 | 0.086 | 88 | 0.60 | ±2.0 | 0.205 / 26 | 12 | 2.0 | 8 | 1300 | 4.0 | 91 |