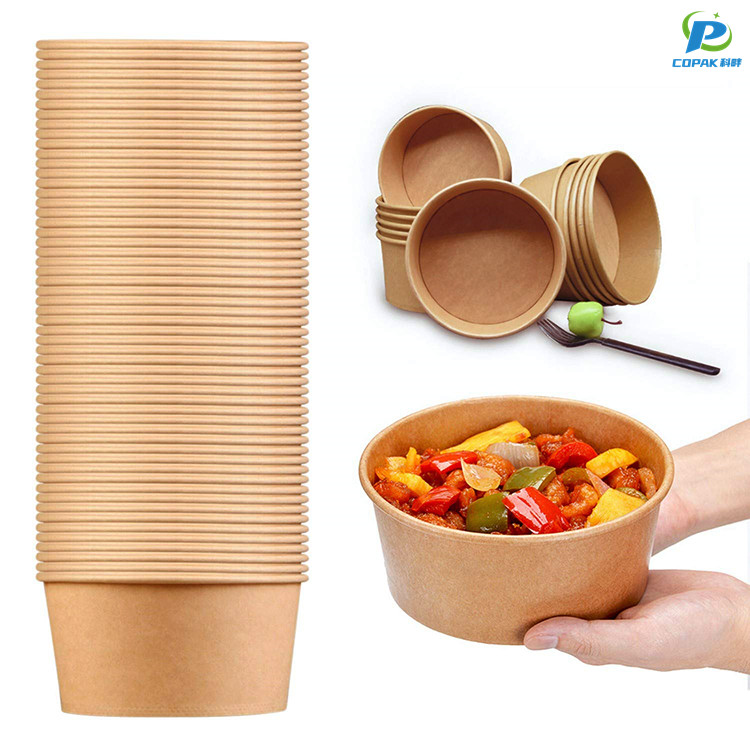
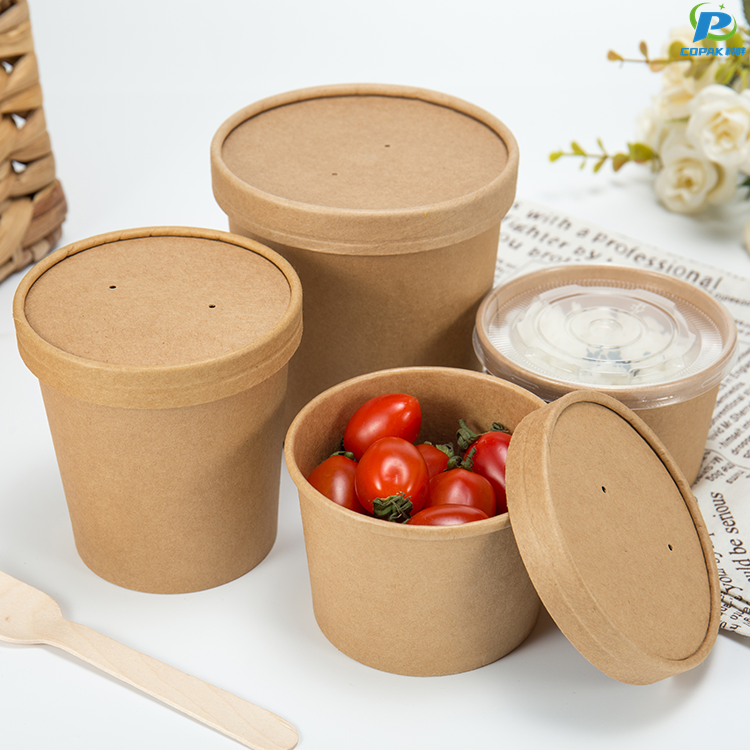
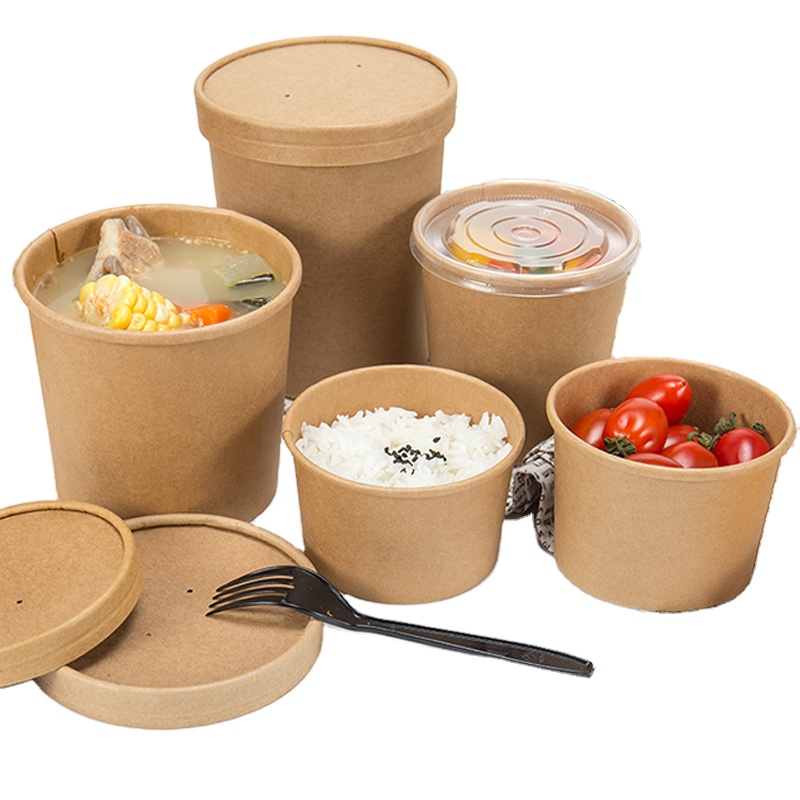
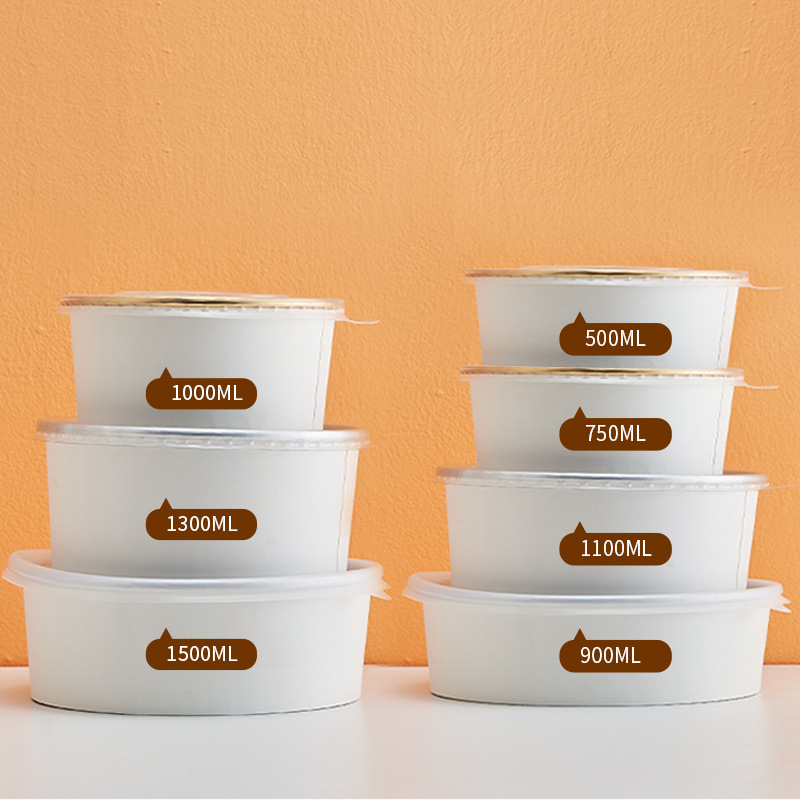
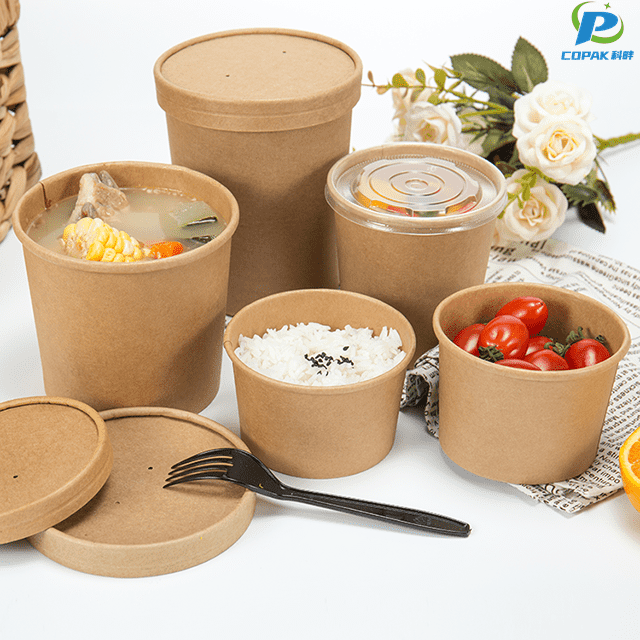
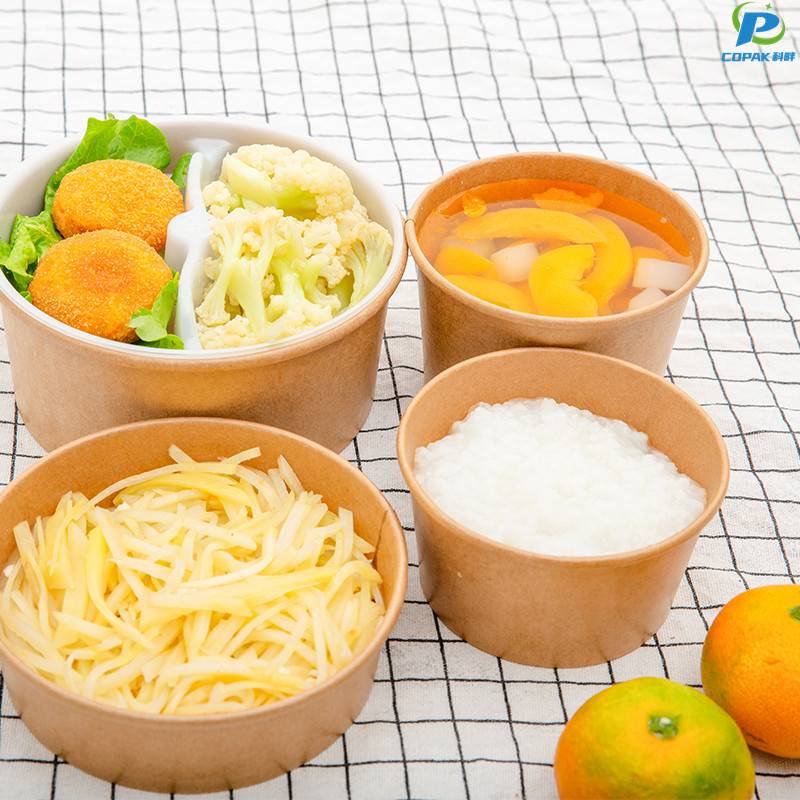
From a China-based manufacturer, I present our Paper Bowl range designed for food service and takeaway businesses. I know what B2B buyers look for: strong structure, biosafe materials, and reliable supply. Our Paper Bowl is made from high-quality, food-grade paper with waterproof coating, enabling hot liquids and greasy foods without leakage. It's compostable and recyclable, aligning with sustainability goals. We offer multiple sizes, stackable design for space savings, custom printing up to 4 colors, and branding options to elevate your brand. MOQ is flexible for pilots and large orders, with sample policy and quick lead times. We ship worldwide, using secure packaging and compliance with relevant regulations. As a China Manufacturer, we control the entire production chain from raw materials to finish goods, ensuring consistent quality and competitive pricing. If you need reliable supply for cafes, caterers, or retailers, I’m ready to discuss your specs, minimums, and delivery timeline.
A Shanghai-based paper bowl manufacturer has risen above the competition by blending advanced production capabilities with rigorous quality control and sustainable materials. Buyers worldwide value our food-safe paper substrates, durable constructions, high-temperature performance and a range of eco-friendly coating options. Flexible customization — sizes, prints, barrier types and packaging — ensures products fit retail, foodservice and private-label needs without compromising consistency. Global procurement teams benefit from reliable lead times, scalable capacity and competitive pricing backed by responsive technical support and transparent supply-chain practices. By prioritizing compliance with international standards and continuous product innovation, we deliver cost-effective, market-ready paper bowl solutions that help buyers win on quality, sustainability and margin.
| Metric | Industry Leader | Sector Average | Top Quartile | Notes |
|---|---|---|---|---|
| Market share (% of segment volume) | 28.5% | 12.3% | 18.7% | Leader holds a clear single-entity share advantage within the paper bowl segment. |
| 3‑year CAGR (annualized) | 9.8% | 5.1% | 7.3% | Higher growth driven by foodservice demand and product differentiation. |
| Average recycled fiber content (%) | 65% | 42% | 55% | Leader emphasizes recycled inputs and closed-loop sourcing. |
| Compostability certification rate (%) | 92% | 68% | 81% | Most SKUs from leader meet recognized industrial compostability standards. |
| Average carbon footprint (kg CO2e / 1,000 units) | 18.4 | 26.7 | 21.0 | Lower footprint achieved via efficient pulp sourcing and energy use. |
| Manufacturing energy intensity (kWh / ton) | 1,150 | 1,480 | 1,260 | Leader operates newer, higher-efficiency production lines. |
| Domestic production share (%) | 74% | 51% | 63% | Higher local production reduces lead times and transport emissions. |
| Export share of shipments (%) | 38% | 22% | 30% | Leader benefits from established international distribution agreements. |
| On‑time delivery rate (%) | 97.2% | 89.5% | 93.1% | Robust logistics and fulfillment processes support reliability. |
| Customer satisfaction (0–100 scale) | 86 | 72 | 79 | Higher service levels and product consistency increase satisfaction. |
| R&D investment (% of revenue) | 3.6% | 1.9% | 2.8% | Above-average R&D spend supports innovation in coatings and materials. |