




Plastic Cup And Straw - China Manufacturer for Premium Plasticware
From our China-based factory, I deliver reliable Plastic Cup And Straw sets to distributors and retailers. As a Manufacturer, I understand the needs of B2B buyers: bulk pricing, consistent quality, and fast lead times. Our Plastic Cup And Straw combos come in clear PET or durable PP, with food-grade linings, leak-proof lids, and compostable or recyclable options. We offer customizable branding, color choices, and straw lengths to fit your market. We ship worldwide with flexible MOQ, packaging options, and product testing certificates. I can tailor packaging to your logistics, including single-use or reusable designs. With short cycle times and steady supply, you can keep your shelves stocked and your customers happy. If you're sourcing Plastic Cup And Straw from a reliable China Manufacturer, let's talk about your order size, lead time, and exact specs, so I can quote you accurately and start production quickly.


Plastic Cup And Straw Ahead of the Curve Your Trusted OEM Partner
Staying ahead of the curve in single‑use and reusable drinkware means partnering with an OEM that blends innovation, reliability and sustainability. We offer end‑to‑end solutions for plastic cups and straws: custom design and rapid prototyping, precision tooling, a wide material palette (PP, PET, PS, food‑grade PLA and recycled resins), multiple manufacturing methods and in‑house printing and finishing. From leak‑proof lids and nested cup systems to eco‑friendly compostable options, every component can be tailored for size, color, branding and performance. Quality and supply stability are at the core of our service: certified food‑safety processes, rigorous QC at each production stage, scalable capacity for both small runs and mass orders, and flexible packaging and logistics to meet global timelines. Competitive pricing, transparent lead times and a responsive technical team ensure your concept moves smoothly from sample to shelf. Partner with an OEM focused on continuous improvement and practical sustainability to bring market‑ready cup and straw solutions to customers worldwide.
| Product Type | Material (Common Name) | Typical Size / Capacity | Wall Thickness (mm) | Processing Temp (°C) | Tensile Strength (MPa) | Recyclability / End-of-Life | Food-Contact Compliance | Biodegradable / Compostable | Typical Manufacturing | Typical Use Cases |
|---|---|---|---|---|---|---|---|---|---|---|
| Cup | PET (Polyethylene Terephthalate) | 250 mL (8 oz), 350 mL (12 oz), 500 mL (16.9 oz) | 0.20 – 0.35 | 250 – 280 | 55 – 75 | Recyclable (Code #1) | Widely available in FDA & EU food-contact grades | No | Thermoforming / Injection stretch | Clear cold beverage cups, display transparency |
| Cup | PP (Polypropylene) | 200 mL, 350 mL, 700 mL | 0.25 – 0.50 | 180 – 240 | 30 – 40 | Recyclable where accepted (Code #5) | Widely available in food-grade formulations | No | Injection molding / Thermoforming | Hot & cold beverage cups; microwave-safe grades |
| Cup | PS (Polystyrene — GPPS / HIPS) | 250 mL, 350 mL | 0.18 – 0.30 | 200 – 260 | 30 – 50 | Limited recycling (Code #6 in some streams) | Food-contact grades commonly available | No | Thermoforming / Injection | Clear single-use cold cups, lids |
| Cup | PLA (Polylactic Acid) | 250 mL, 350 mL | 0.25 – 0.45 | 160 – 180 | 50 – 70 | Industrial composting recommended; not widely recyclable | Available in food-contact / compostable grades | Yes (industrial composting) | Thermoforming / Extrusion | Compostable hot/cold cups (limited heat tolerance) |
| Straw | PP (Polypropylene) | Ø6 mm (standard), Ø8–12 mm (bubble/iced drinks); length ~200–250 mm | 0.30 – 0.70 | 180 – 240 | 30 – 40 | Recyclable where accepted (Code #5) | Food-grade options commonly available | No | Extrusion → Cutting / Flex-joint forming | Standard straws; flexible and reinforced variants |
| Straw | PET (Polyethylene Terephthalate) | Ø6–10 mm; length ~200–300 mm | 0.25 – 0.60 | 250 – 280 | 55 – 75 | Recyclable (Code #1) | Food-grade PET commonly available | No | Extrusion → Cut / Join | Rigid clear straws; premium transparent options |
| Straw | PLA (Polylactic Acid) | Ø8–12 mm (wide straw), length ~200–260 mm | 0.35 – 0.80 | 160 – 190 | 50 – 70 | Industrial composting recommended | Available in certified compostable food-contact grades | Yes (industrial composting) | Extrusion / Heat forming | Compostable straws for cold drinks, bubble tea options |
| Specialty Cup | BOPET (Bi-axially Oriented PET) | 350 mL (custom sizes common) | 0.18 – 0.30 | 250 – 280 (orientation processing) | 60 – 100 (orientation increases strength) | Recyclable (Code #1) | Food-grade BOPET available | No | Thermoforming with orientation / Heat-set forming | High-clarity, strong cold cups; printed barrier films |
Related Products


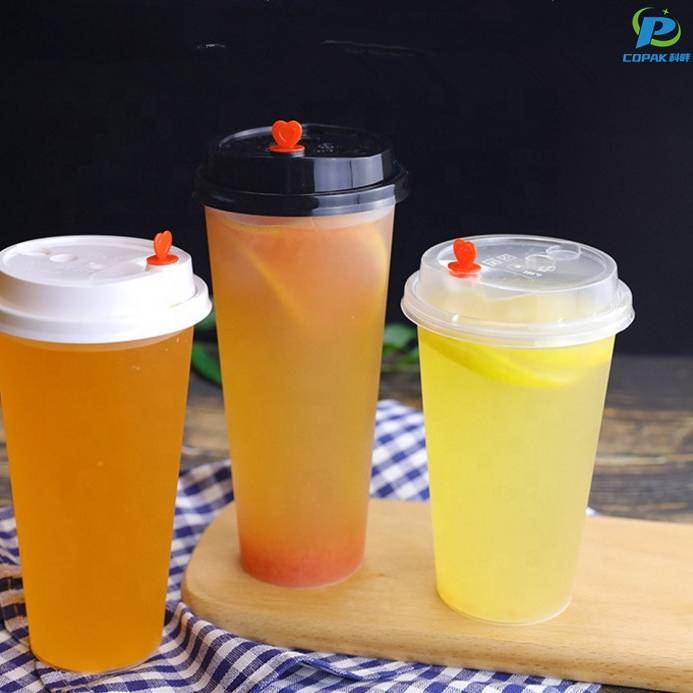


Plastic Cup And Straw Factory Leads the Global Market
Top Selling Products






- Related Blog
- Reviews
- Reviews
