




Plastic Cups And Lids Manufacturer In China
I’m a China-based Manufacturer specializing in Plastic Cups And Lids, and I bring reliable packaging solutions to distributors, retailers, and foodservice brands. From our factory floor to your warehouse, I offer a full range of clear and colored cups with matching lids, designed to protect contents and enhance shelf appeal. We use food-grade materials, rigorous QC, and traceable production flows to ensure consistency batch after batch. You can count on flexible MOQs, fast sampling, and ODM/OEM customization—sizes, colors, print logos, and packaging options tailored to your market. My team ships worldwide with competitive freight rates, support for private labeling, and documentation to meet import requirements. Whether you need standard stock or a tailored solution for China or international markets, I’ll work with you to hit your timelines and budget. Plastic Cups And Lids that perform, backed by a manufacturer you can trust.


Plastic Cups And Lids Industry Giant Now Trending
The plastic cups and lids industry giant now trending is transforming global sourcing with a blend of scale, quality and innovation. As demand shifts toward food-safe, recyclable and compostable options, a Shanghai-based manufacturer is leading with diversified materials (PP, PET, PS, PLA), precise molding, full-color printing and customizable sizes and lids. Robust R&D and strict certifications ensure products meet FDA and EU standards while new eco-friendly lines reduce plastic footprint without sacrificing performance. For global buyers, this means reliable lead times, competitive pricing and flexible MOQ for both private-label and contract manufacturing. End-to-end supply-chain capabilities—from product development and sample prototyping to automated production and export packaging—make large-volume fulfillment and seasonal ramp-ups seamless. Buyers seeking a stable, experienced partner in disposable beverage packaging will find this industry leader well-positioned to support market growth and sustainability goals.
| Metric | Value / Trend (Latest Available) | Notes & Context |
|---|---|---|
| Global annual consumption (units) | ~120 billion units (2023); projected ~128 billion units (2030) | Estimate covers single‑use plastic cups and matching lids for foodservice and retail single‑serve applications; modest growth driven by population & convenience trends offset by regulatory restrictions and reuse initiatives. |
| Compound annual growth rate (CAGR) | ~1.2% (2023–2030, volume) | Low single‑digit growth expected as sustainability policies and alternative packaging options moderate historical demand. |
| Material share by weight (global, 2023) | PP ~42% • PET ~28% • PS ~18% • PLA/compostables ~8% • Other ~4% | Polypropylene (PP) leads due to heat resistance and cost; biodegradable/compostable share rising from a low base. |
| Regional volume share (2023) | Asia‑Pacific 56% • North America 18% • Europe 15% • Latin America 6% • MEA 5% | Asia‑Pacific remains the largest market by units due to population and high foodservice fragmentation; per‑capita use higher in developed regions. |
| End‑use application split | Foodservice & takeaway 65% • Retail single‑serve 15% • Events & vending 12% • Other 8% | Foodservice dominates; growth in delivery/takeaway channels continues to support demand for lids and sealed cups. |
| Recycling & recovery rates (global) | Mechanical recycling ≈ 8% (2022); composting/industrial recovery for bioplastics ≈ 3% | Low recovery driven by contamination and mixed‑material products; investments in collection and sortation needed to improve rates. |
| Bioplastic / compostable adoption | ~12% of new product launches (2022–2024); expected 18–22% share of new launches by 2027 | Adoption concentrated in regions with composting infrastructure and where consumer willingness to pay is higher. |
| Policy & regulatory impact | ~45 jurisdictions with partial/full restrictions on single‑use cups (2020–2024) | Restrictions, fees, and reuse mandates are uneven by region; some policies encourage reusable systems rather than only material substitution. |
| Average carbon footprint (kg CO2e per 1,000 cups) | PP ≈ 40 kg CO2e • PET ≈ 45 kg CO2e • PLA ≈ 50 kg CO2e (end‑of‑life dependent) | Lifecycle emissions vary with feedstock, energy mix, and end‑of‑life; reusable systems generally show lower per‑use emissions when operating at scale. |
| Circularity measures in market | Deposit/refund pilots and cup return schemes expanding in major cities; corporate reuse pilots increasing | Pilot programs aim to scale reuse in urban foodservice; success depends on convenience for consumers and cost allocation. |
| R&D & innovation focus areas | Light‑weighting, mono‑polymer designs, recyclability by design, compostable formulations, digital tracking for returns | Design for recyclability (mono‑material lids/cups) and improved separation technologies are priorities to raise recovery rates. |
| Short‑term market drivers (next 24 months) | Regulatory push, food delivery growth, consumer sustainability demand, supply chain raw material volatility | Raw material price swings can affect material selection; policy changes can create rapid local demand shifts toward alternatives. |
| Key commercial risks | Policy headwinds, low recyclability of mixed designs, reputational pressure, feedstock supply constraints for bioplastics | Companies and processors face transition risks while adapting to changing regulations and collection infrastructure. |
Related Products




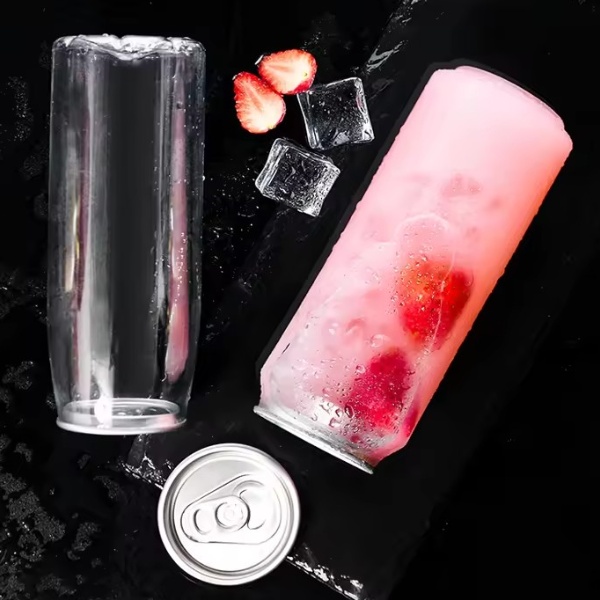


Plastic Cups And Lids Exceeds Industry Benchmarks Factory-Direct Excellence
Top Selling Products





- Related Blog
- Reviews
- Reviews
