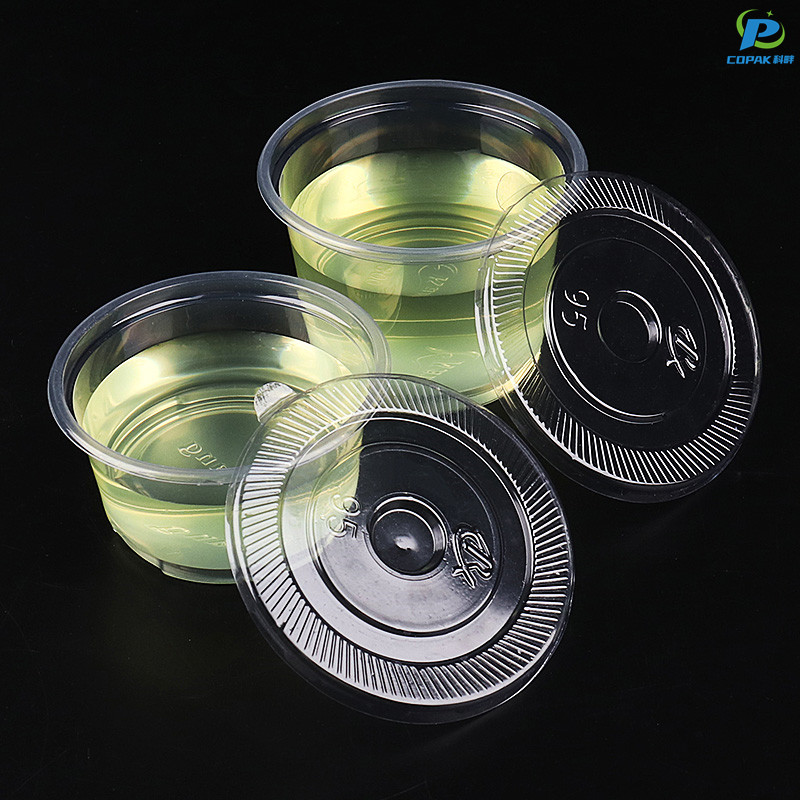
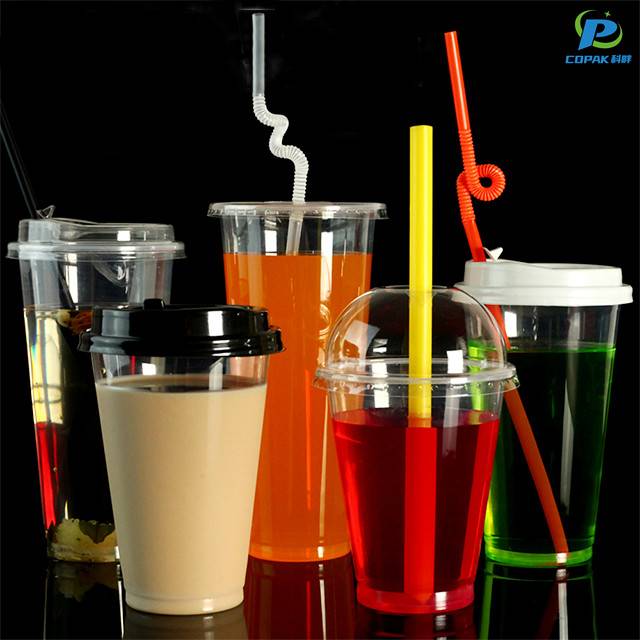
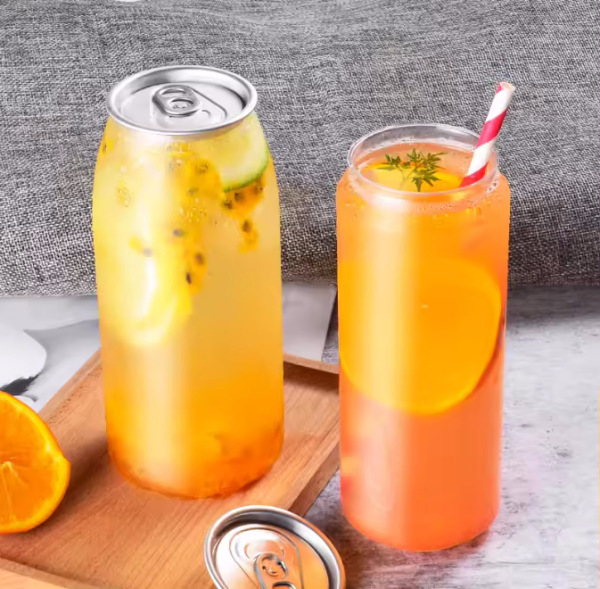
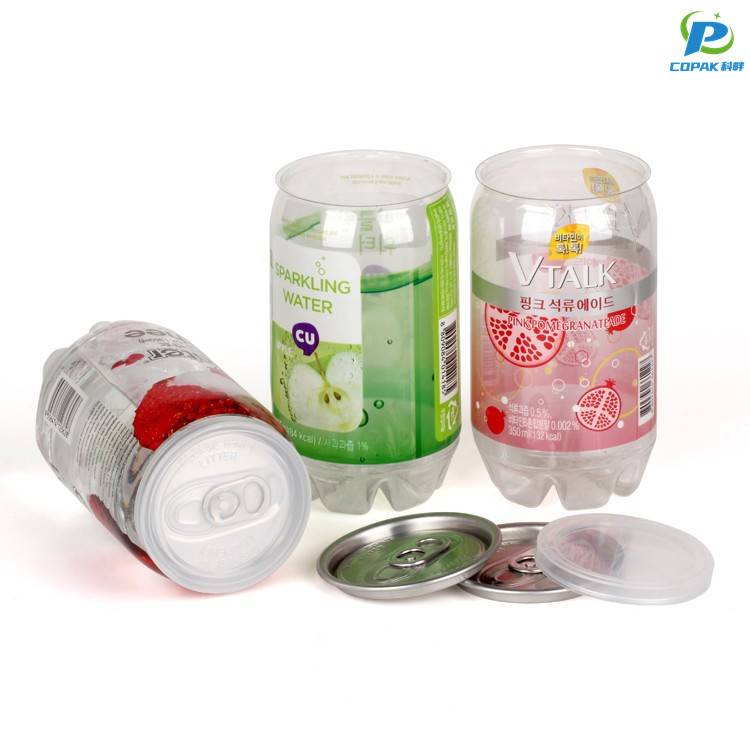
I'm a China-based Manufacturer and supplier, and I specialize in Plastic Drinking Cups With Lids that meet the needs of cafes, catering, and mass retailers. Our team provides reliable supply, consistent thickness, and leak-resistant lids designed to prevent spills during transport and service. I offer a range of sizes, clear or frosted finishes, and molded-in graduations for portion control. These cups are made from BPA-free plastics, safe for cold beverages, and compatible with standard beverage lids. As a manufacturer, I understand the importance of lead times, competitive pricing, and quality control; we run strict QC checks and provide flexible MOQs for B2B buyers. We can customize printing logos or branding to boost your promotional campaigns. If you’re sourcing from China, you’ll find our production capacity and logistics dependable for large orders. Let me know your target quantities and preferred styles, and I’ll tailor a solution that keeps your customers satisfied and your margins healthy.
In 2025 global buyers of plastic drinking cups with lids expect more than a transactional supplier: they seek a strategic partner who understands markets, regulations and sustainability goals. From recyclable PP and rPET to compostable blends, a partner helps select materials, optimize lid designs for spill-resistance and insulation, and develop compliant, branded solutions with rapid prototyping and quality testing. Choosing a partner means integrated support across sourcing, production and logistics: flexible MOQs, reliable lead times, certified QC, customized packaging and cost-to-serve optimization for different regions. For global procurement teams, that partnership accelerates product launches, reduces risk and advances circularity—turning single-item buys into long-term value and innovation.
| Product Category | Typical Capacity | Common Polymer | Lid Style | Recyclability / End‑of‑life | Manufacturing & Cycle Time | Typical Applications | Environmental & Quality Notes |
|---|---|---|---|---|---|---|---|
| Clear single‑use cold cup (thermoformed) | 200–700 ml (7–24 oz) | PET (Polyethylene terephthalate) | Flat snap‑on & dome lids for cold drinks |
Widely recyclable where PET collection and sorting exist; thin‑wall cups may be excluded in some municipal streams.
Notes: material separation critical; contamination reduces recyclability.
|
Thermoforming or sheet forming; typical cycle 5–20 s per part (highly automated lines). | Cold beverages, takeaway cafés, events, fountain drinks | Estimated cradle‑to‑gate footprint: ~25–80 g CO2e per cup (range depends on weight & recycling rate). Common QC: dimensional accuracy, lid fit, clarity inspection, migration screening for food contact. |
| Single‑use stackable cups (injection molded) | 150–500 ml (5–17 oz) | PP (Polypropylene) | Snap lids, hinged sip‑lids |
Recyclable in many regions but lower collection and sorting rates vs PET; mixed‑polymer contamination can hinder recycling.
Notes: widely used for cold & ambient drinks.
|
Injection molding; typical cycle 7–25 s depending on wall thickness and mold cavitation. | Cafes, self‑service stations, samples, merchandising giveaways | Estimated footprint: ~25–70 g CO2e per cup. QC tests: lid retention, drop/resistance, dimensional stacks, food contact compliance. |
| Rigid polystyrene (PS) cups | 180–450 ml (6–15 oz) | PS (Polystyrene) — rigid or foam | Flat snap lids; foam often used without lids |
Recyclability limited in many municipal programs; foam variants often banned or discouraged in several markets.
Notes: phase‑out trends in some regions.
|
Thermoforming or molding; cycle times vary 5–20 s. | Cold drinks, short‑term single serve, legacy foodservice uses | Lower material mass for foam but structural/insulation tradeoffs; QC includes impact resistance and dimensional tolerances. |
| Compostable cups (PLA or blended bioplastics) | 200–500 ml (7–17 oz) | PLA (Polylactic acid); PLA blends (compostable certified) | Compostable flat & dome lids (PLA or fiber lids) |
Generally not recyclable in conventional plastic streams; accepts industrial composting (certified systems required).
Notes: home compostability limited; contamination of recycling streams can reduce value.
|
Thermoforming or injection; cycle times typically 10–30 s; moisture sensitivity requires controlled processing. | Eco‑positioned cafés, events with commercial composting, short‑term cold drinks | Certified to standards such as EN 13432 / ASTM D6400 for industrial composting when applicable. Estimated cradle‑to‑gate footprint: variable, commonly ~30–120 g CO2e per cup depending on feedstock and processing. |
| Reusable durable plastic cups with lids (copolyester / high‑durability) | 350–600 ml (12–20 oz) | Copolyesters, high‑impact PP, engineered resins (BPA‑free) | Screw lids, snap lids with silicone seals, sliding sip covers |
Recyclable depending on polymer; designed for many reuse cycles — lifecycle benefit realized at scale via repeated use.
Notes: end‑of‑life recycling requires separation by resin type.
|
Injection molding and assembly; cycle times 15–45 s for thicker/walled parts; secondary operations (overmolding, sealing) common. | Reusable programs, branded merchandise, outdoor & hospitality uses | Higher per‑item manufacturing footprint (~600–1,200 g CO2e cradle‑to‑gate) but per‑use footprint drops sharply with reuse (e.g., at 100 uses → ~6–12 g CO2e/use). QC: dishwasher resistance, impact testing, migration/durability tests, lid sealing & leak tests. |
| Double‑wall insulated plastic cups (non‑metal, multi‑wall) | 300–500 ml (10–17 oz) | Multi‑layer PP/PE or co‑extruded polymers | Screw lids, gasketed snap lids, sip covers |
Multi‑layer constructions reduce recyclability in standard streams; separation is technically possible but not widely implemented.
Notes: design for disassembly recommended to improve end‑of‑life outcomes.
|
Injection molding with assembly; cycle times 20–40 s; thermal bonding or ultrasonic welding often used. | Hot & cold takeaway drinks (insulation), premium reusable drinkware | Higher material and process intensity; QC focuses on insulation performance, wall integrity, thermal cycling, and lid seal longevity. |