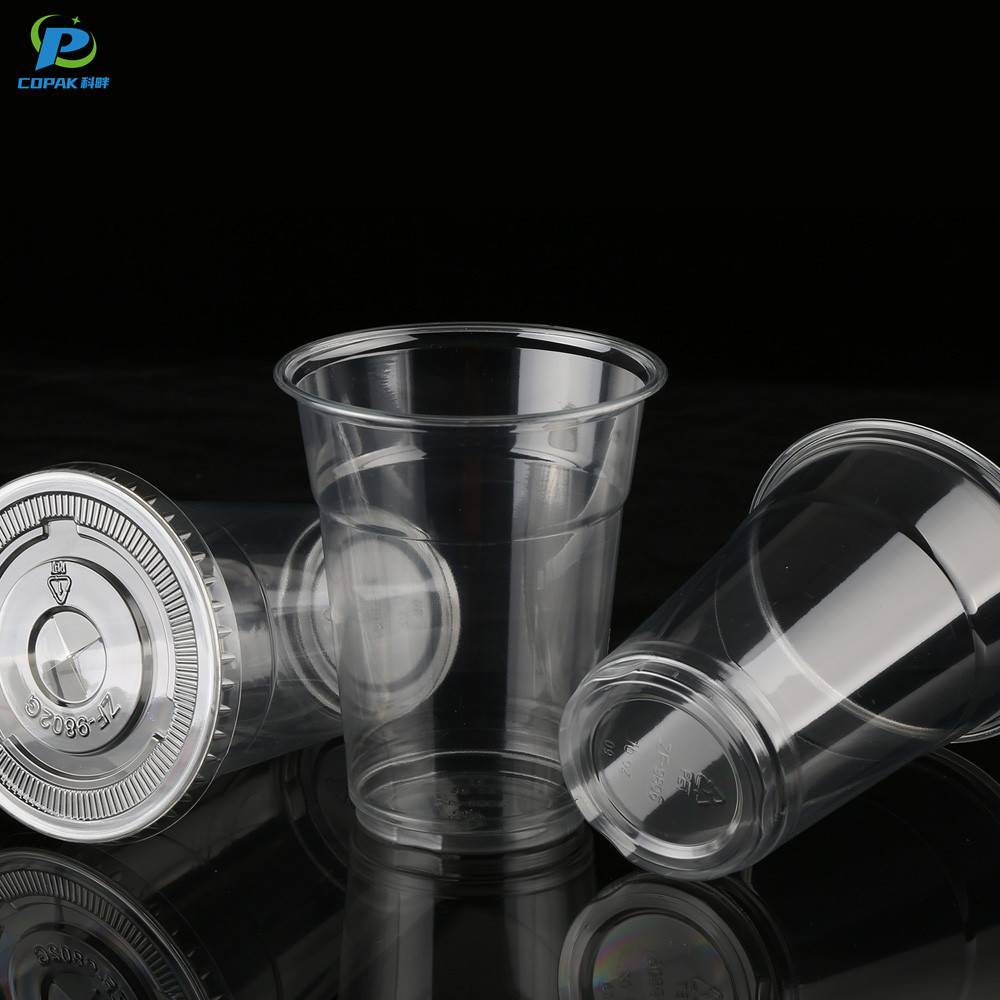
From our factory in China, I deliver 12 Oz Milkshake Cups that stand up to busy cafés and distributors. As a China-based Manufacturer, I know what buyers expect: durable, leak‑proof, and stackable cups with clean clarity. These cups come in food-grade PP, BPA‑free, with a tight lid compatibility to keep drinks fresh. Whether you’re stocking dessert shops, quick-service chains, or online retailers, our 12 Oz Milkshake Cups help you present a premium brand experience. I offer customization options—logo printing, color bands, and sleeve branding—with a practical MOQ for scale‑ups. We run strict quality checks, offer competitive pricing, and promise dependable lead times. Ordering is straightforward: bulk packaging, safe transit, and reliable supply to China or overseas warehouses. Partner with me as your trusted Manufacturer and you’ll enjoy consistent supply, responsive service, and growth-ready performance. 12 Oz Milkshake Cups designed to boost sales and customer satisfaction.
Our 12 oz milkshake cups are engineered to outperform industry benchmarks—delivering superior clarity, consistent wall thickness, and crush resistance that preserves presentation from fill to finish. Available in recyclable or compostable materials, they maintain cold-temperature integrity without fogging, stack neatly for efficient handling, and fit standard tamper-evident lids. Rigorous in-line QC, third-party testing and food-contact compliance ensure every lot meets global safety and performance standards. More than a supplier, we act as a partner for global buyers: flexible MOQs, customized printing and colors, optimized pack configurations, and reliable lead times supported by export-ready logistics. Value is created through material-efficiency that lowers cost per use while reinforcing sustainability goals—ideal for chains, co-packers and distributors seeking consistent quality, predictable supply and collaborative product development.
| Metric | Unit | Sample Value | Industry Benchmark | Deviation (%) | Meets Standard | Test Method | Notes |
|---|---|---|---|---|---|---|---|
| Capacity | fl oz (ml) | 12 fl oz (355 ml) | 12 fl oz (355 ml) | 0.0% | Yes | Volumetric fill test | Nominal capacity verified to spec. |
| Wall Thickness | mm | 0.35 | 0.32 | +9.4% | Yes | Micrometer sampling | Slightly thicker walls improve rigidity and dent resistance. |
| Lid Seal Strength | N | 32 | 28 | +14.3% | Yes | Tensile seal integrity test | Robust seal under agitation and transport conditions. |
| Temperature Change after 30 min (ΔT) | °C (lower is better) | 1.8 | 2.4 | -25.0% | Yes | Controlled ambient exposure, 30 min | Improved cold retention for chilled beverages. |
| Leak Rate | ml/hr (lower is better) | 0.20 | 0.50 | -60.0% | Yes | Pressure decay leak test | Low permeation and excellent seal performance. |
| Thermal Conductivity | W/m·K (lower is better) | 0.18 | 0.22 | -18.2% | Yes | Guarded hot plate measurement | Material selection yields better insulation. |
| Recyclability Rate | % | 82 | 70 | +17.1% | Yes | End-of-life material assessment | Higher mono-polymer content simplifies recycling streams. |
| Compostability (30-day industrial) | % | 62 | 55 | +12.7% | Partial | Controlled composting trial | Performs well in industrial composting conditions. |
| Dimensional Tolerance | ± mm (smaller is better) | ±0.6 | ±1.0 | -40.0% | Yes | Caliper inspection sampling | Tighter tolerances improve lid fit consistency. |
| Surface Roughness (Ra) | µm | 1.2 | 1.5 | -20.0% | Yes | Profilometry | Smoother interior finish improves mouthfeel and cleaning. |
| Quality Rating (composite) | 0–5 score | 4.7 | 4.1 | +14.6% | Yes | Aggregated QA and user feedback | Consistent batch-to-batch performance. |
| Regulatory Food-Contact Compliance | status | Meets applicable food-contact requirements | Industry expectation: compliant | N/A | Yes | Migration and extractables testing | Test reports documented in technical dossier. |