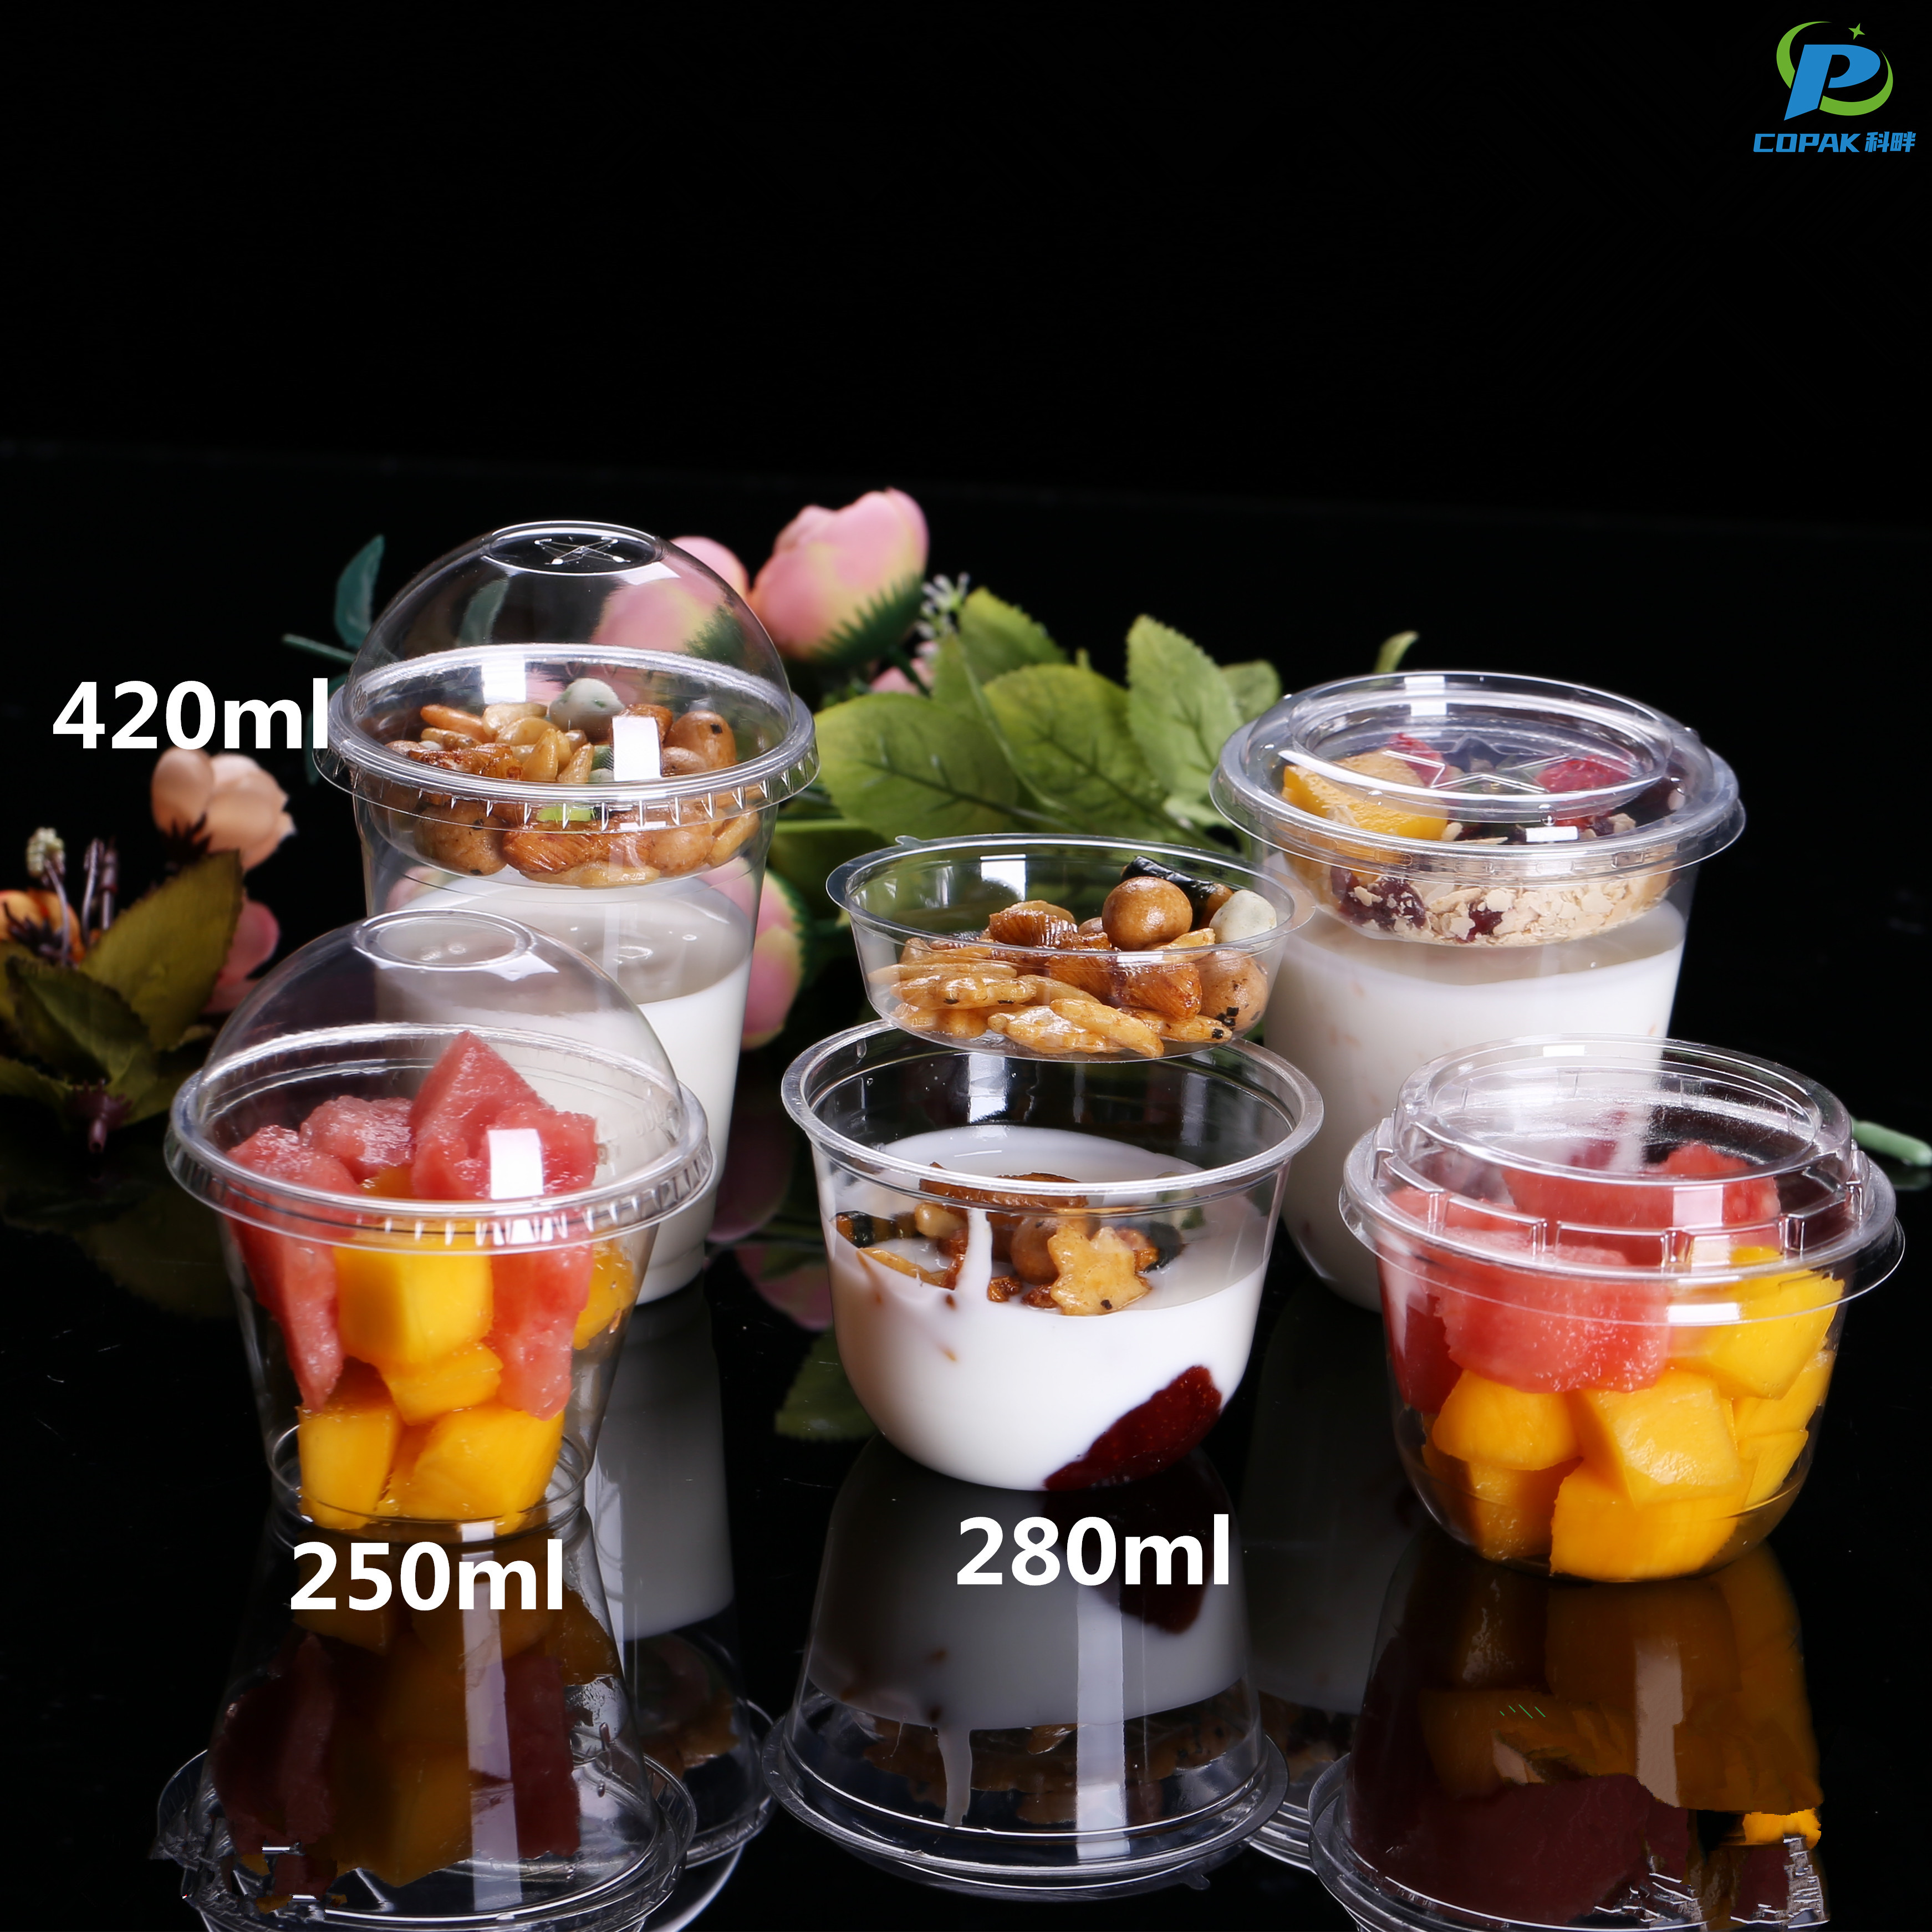
From a China-based manufacturer, I know what B2B buyers want: reliable, safe, and cost-effective packaging. Our Clear Disposable Cups are designed for hot and cold beverages, offering crystal-clear clarity, sturdy rims, and leak-resistant performance. We source and assemble in China with strict QC, ensuring no tainting of taste or aroma. Available in 8 oz, 12 oz, and 16 oz sizes, these cups are compatible with standard lids, stackable for easy storage, and fully recyclable. We also offer customization options—logo printing, batch codes, and private packaging for bulk orders—to boost brand visibility and streamline warehouse handling. For distributors and service chains, the price-to-performance ratio is hard to beat, with fast lead times and reliable supply. If you’re searching for a dependable supplier in China, let’s discuss your forecast, MOQs, and delivery terms, and I’ll tailor a solution that fits your business.
As a trusted OEM partner for clear disposable cups, we combine precision tooling, food-grade materials and rigorous quality control to deliver products that consistently outperform competitors. Our production lines are optimized for clarity, strength and lightweight performance, offering options from PET to eco-friendly compostable polymers to meet diverse market demands. Buyers benefit from competitive pricing, flexible minimums, fast tooling and reliable lead times backed by thorough inspection and compliance with international food safety standards. Global procurement teams choose us for responsive customization, from printed logos and tamper-evident lids to tailored packaging that reduces shipping costs and shelf waste. Our supply chain resilience and commitment to continuous improvement ensure scalable capacity, consistent color and dimension tolerances, and after-sales support—so you get repeatable quality, on-time delivery and the commercial edge you need in competitive retail and foodservice markets.
| Product Type / Material | Typical Capacity (ml / oz) | Dimensions (Ø x H mm) | Wall Thickness (µm) | Transparency (% light transmittance) | Heat Resistance (max °C) | Recyclability | Compostability | Common Certifications | Typical Use Cases | Avg Weight per Cup (g) | Estimated CO2e per Cup (g) |
|---|---|---|---|---|---|---|---|---|---|---|---|
|
Clear PET (Polyethylene terephthalate)
High clarity cold beverage cup
|
355 ml / 12 oz | Ø 90 × H 110 | ~240 | ~92% | ~60°C | Widely recyclable in PET streams (material code #1) | No (not industrially compostable) | FDA food-contact; EU 10/2011 | Cold drinks, iced coffee, smoothies | ~6.5 g | ~18 g CO2e |
|
rPET (Recycled PET, transparent)
Post-consumer content; lower virgin demand
|
473 ml / 16 oz | Ø 95 × H 130 | ~260 | ~88% | ~60°C | Recyclable where PET collection exists; recycling stream dependent | No (not industrially compostable) | FDA food-contact (processed material); EU 10/2011; recycled-content verification | Cold beverages, outdoor events, vending | ~7.2 g | ~11 g CO2e |
|
PLA (Polylactic Acid)
Bioplastic, industrially compostable
|
355 ml / 12 oz | Ø 90 × H 110 | ~300 | ~90% | ~45°C (limited hot use) | Typically not accepted in conventional PET/PP recycling streams | Yes — industrial composting (EN 13432 / ASTM D6400 compliant options) | EN 13432; ASTM D6400; FDA food-contact | Cold beverages, chilled desserts, takeaway salads | ~7.5 g | ~12 g CO2e |
|
Clear PP (Polypropylene)
Good hot tolerance, microwave-safe options
|
355 ml / 12 oz | Ø 86 × H 115 | ~350 | ~85% | ~120°C | Recyclable in PP streams where accepted (material code #5) | No (not industrially compostable) | FDA food-contact; EU 10/2011 | Hot beverages, soups, microwaveable foods | ~9.5 g | ~25 g CO2e |
|
Crystal PS (Polystyrene, crystal)
Very clear, light-weight for small servings
|
250 ml / 8 oz | Ø 76 × H 95 | ~180 | ~95% | ~60°C (brittle when cold) | Recyclable where PS collection exists (limited) | No (not industrially compostable) | FDA food-contact; EU food-contact regulations | Sample cups, cold desserts, portion cups | ~4.5 g | ~14 g CO2e |