PET Bottles

PET 16 Oz Bottles - China Manufacturer for Packaging Solutions

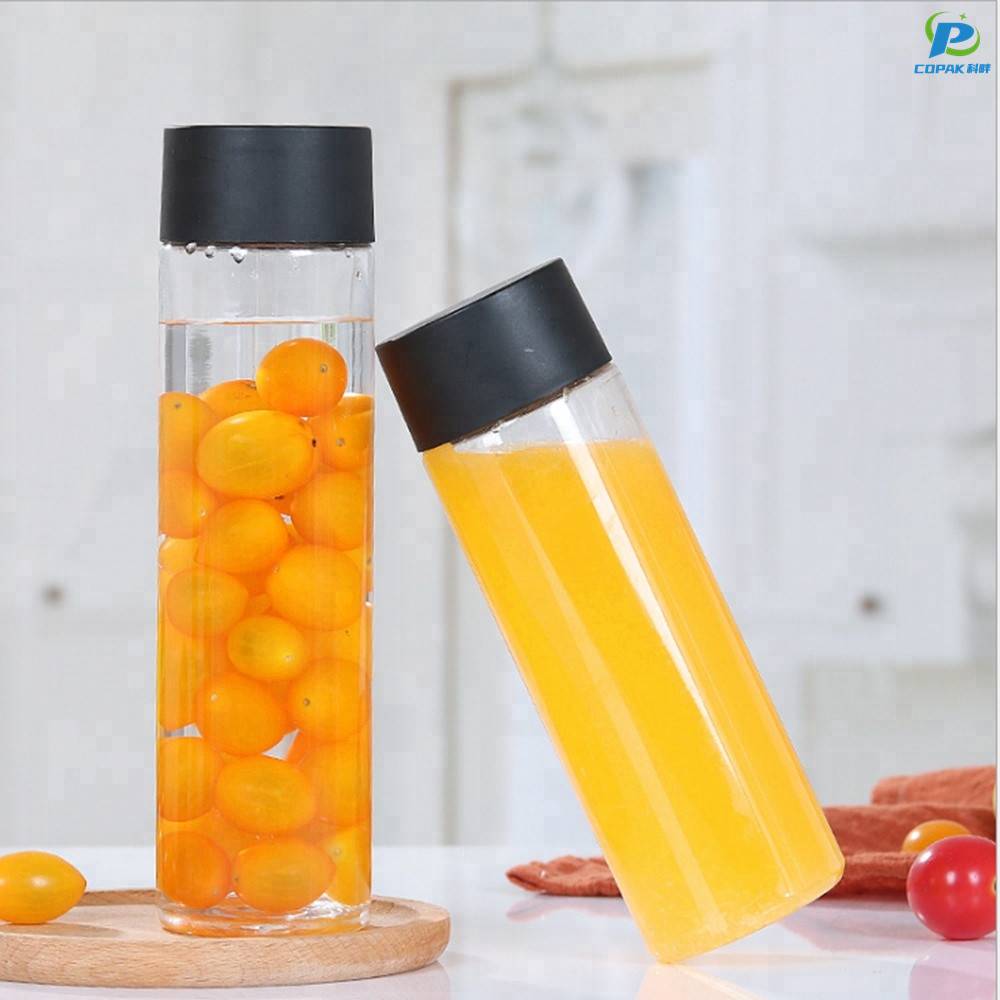
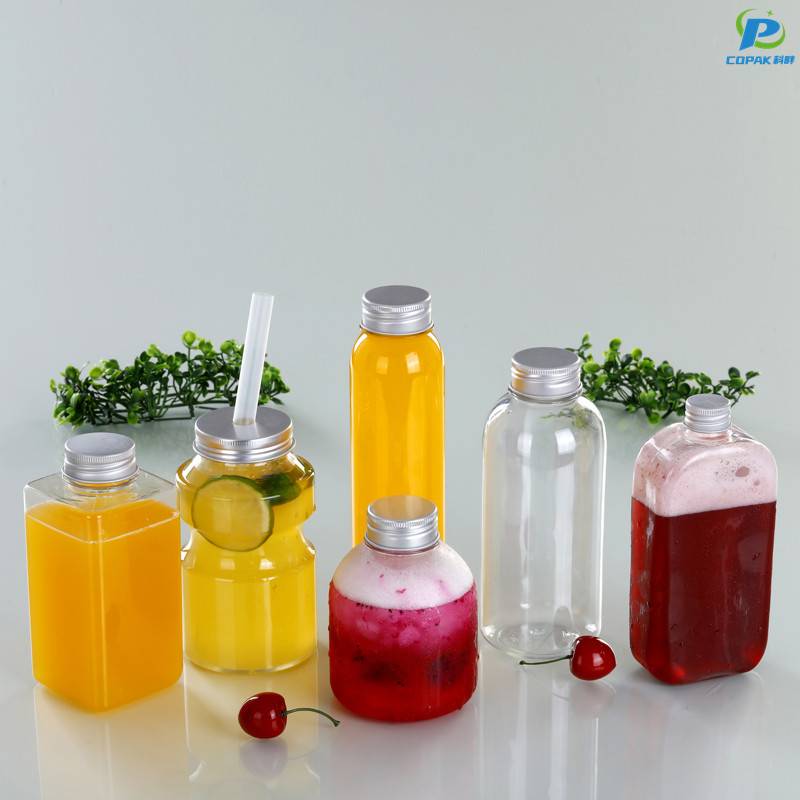
I'm a {China}-based {Manufacturer}, and I supply {PET 16 Oz Bottles} designed for bulk buyers who chase reliability and value. Our range features food-grade, BPA-free PET bottles that resist drops and temperature swings, showing your label with crystal clarity. For beverage, cosmetic, or household lines, these 16 oz bottles fit standard caps and spray tops, with options for color and caps. We can tailor printing, labeling, and tamper-evident seals to your brand with short lead times. From our {China} factory, I can assure consistent quality, competitive pricing, and steady supply for distributors, retailers, and manufacturers scaling up. MOQ is flexible, and I conduct QC before shipment so you won’t have surprises. If you plan large orders, let’s discuss specs, packaging, and delivery timelines.
Hot Selling Product

PET 16 Oz Bottles Pioneers in the Field Outperforms the Competition

As pioneers in the PET packaging field, our 16 oz bottles combine lightweight efficiency with outstanding performance—crystal clarity, excellent impact resistance, and food-grade safety that extend shelf life and protect beverage integrity. Engineered for superior barrier properties and consistency, these bottles outpace competitors by offering easy fill-fill, stable stacking, and recyclable materials that meet growing sustainability demands from global markets. Manufactured by an experienced Shanghai-based production team using advanced stretch-blow molding and strict quality controls, we provide customizable options—neck finishes, colors, barrier treatments, labeling and tamper-evident features—to suit diverse product lines. With scalable capacity, reliable lead times, competitive pricing and export-ready packaging, these 16 oz PET bottles are an ideal choice for importers and brands seeking performance, compliance and supply-chain confidence.

{ PET 16 Oz Bottles Pioneers in the Field Outperforms the Competition}

Metric Unit Pioneer 16 oz PET (Optimized) Industry Average 16 oz PET Benchmark / Notes
Nominal capacity mL (oz) 473 mL (16 oz) 473 mL (16 oz) Standard nominal volume for 16 oz bottles (473.176 mL)
Average bottle mass g 18 g 24 g Lightweight molding and neck-ring redesign reduce mass by ~25% vs typical bottles
Material density (PET) g/cm³ 1.38 1.38 Typical intrinsic density for amorphous PET used in beverage bottles
Average wall thickness mm ≈0.38 mm (body average) ≈0.55 mm (body average) Thinner walls enabled by optimized preform and stretch-blow parameters
Peak melt processing temperature °C ≈250 °C ≈250 °C Typical processing range for PET (240–270 °C) in injection/stretch-blow molding
Mechanical recycling collection rate (typical stream) % 72% 52% Design-for-recycling features (label-less panels, compatible caps) improve capture rate in sorting streams; regional variation applies
Average post-consumer recycled content used % 30% 12% Higher rPET use reduces virgin material demand; achievable where quality-sorted feedstock is available
Cradle-to-gate carbon footprint g CO2e / bottle ≈85 g CO2e ≈120 g CO2e Includes material production + preform/blow molding energy; values vary with electricity mix and rPET share
Energy consumption (production) MJ / bottle ≈0.35 MJ ≈0.55 MJ Lower mass and efficient cycle times reduce per-bottle energy
Tensile strength (machine direction, typical) MPa ≈58 MPa ≈50 MPa Orientation during stretch-blow increases mechanical properties; values depend on preform crystallinity
Oxygen transmission rate (OTR) mL/m²/day ≈0.3 ≈0.5 Low OTR supports extended shelf life for non-carbonated beverages; barrier coatings or multilayering can further reduce OTR
Typical filled shelf life (water/low-acid beverages) months ≈12 months ≈9 months Shelf life influenced by OTR, light exposure, and beverage formulation
End-of-life pathways Curbside mechanical recycling, deposit-return recovery, chemical depolymerization options Curbside mechanical recycling, landfill, energy recovery where available Design-for-recycling (mono-material, compatible labels/caps) increases value of collected stream
Regulatory / food-contact notes Formulated to meet common food-contact regulatory requirements (e.g., FDA/EFSA guidelines for PET articles) Typical industry compliance; verification depends on manufacturing and additives Verification required per region and specific formulation
Data shown are representative typical values and industry averages for 16 oz (473 mL) PET beverage bottles. Actual values vary with processing, regional recycling infrastructure, and material sourcing.

Related Products

PET Cups

PET 16 Oz Bottles Dominates Manufacturers You Can Rely On

Regional Production Volume for 16 oz PET Bottles (Thousands of Units, Q1 Snapshot)

This chart visualizes the regional production volume distribution for 16 oz PET bottles measured in thousands of units for a single quarter. The dataset highlights five manufacturing regions: Asia-Pacific, North America, Europe, Latin America, and Middle East & Africa. Asia-Pacific leads significantly, reflecting concentrated capacity and high demand from beverage and consumer goods sectors in that region. North America and Europe follow as mid-tier producers with established manufacturing bases and mature supply chains that sustain steady output. Latin America and Middle East & Africa register lower volumes, indicating either nascent manufacturing investment or a larger reliance on imports. Several factors can explain these differences: availability of raw materials such as PET resin, local investment in blow molding and bottling infrastructure, logistics efficiency, and regional demand patterns for single-serve beverage packaging. The taller bar for Asia-Pacific suggests economies of scale and integrated supply chains that reduce per-unit cost, enabling higher throughput. Conversely, lower bars reveal potential opportunities for capacity expansion or for companies targeting underserved markets to invest in localized production. When interpreting the chart, consider that production volume alone does not capture quality, sustainability practices, or recycling integration; complementary metrics such as recycled resin usage and energy intensity would provide a fuller sustainability profile. For procurement and supply chain planning, this visualization helps prioritize regions for supplier qualification, risk assessment, and inventory positioning. Monitoring trends across multiple quarters would reveal whether observed dominance is persistent or cyclical. Finally, stakeholders should use such regional production snapshots as one input among demand forecasts, trade policy analysis, and raw material market dynamics when deciding where to source or expand 16 oz PET bottle production. Complementary analyses on cost curves, regulatory frameworks, and circular-economy initiatives will sharpen strategic decisions and investment prioritization in this sector. Regional labor skill distribution and transport bottlenecks also matter.

Top Selling Products

Subscribe To Our Newsletter

For inquiries about our products or pricelist, please leave your email to us and we will be in touch within 24 hours.

Follow Us

on our social media
  • whatsapp (1)
  • instagram
  • youtube