




PET Cup Manufacturer in China | Trusted China Manufacturer
We are a PET Cup Manufacturer in China, and I’m here to tell you why buyers keep us on their shortlist. I produce food-grade PET cups with strong clarity, sturdy wall, and reliable leak resistance. We offer a wide range of sizes, from 8 oz to 24 oz, with smooth rims and consistent wall thickness. Custom printing is possible, including branding up to 6 colors. We keep a short lead time and stable supply chain so your production won’t stop. Our factory adheres to FDA/CFDA standards, and we use recyclable materials to support sustainability. I believe in long-term partnership, not one-off orders. MOQ is reasonable for trial runs, and we provide testing reports so you can approve before mass production. If you are a buyer from China or abroad, consider us as your trusted Manufacturer who can scale with your growth.
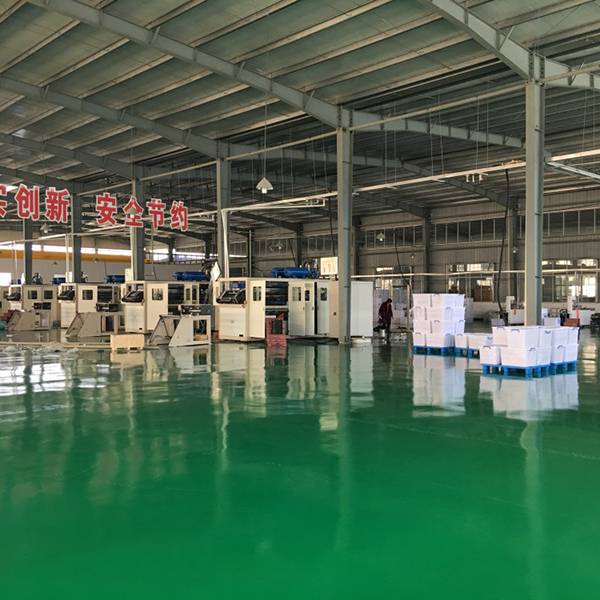

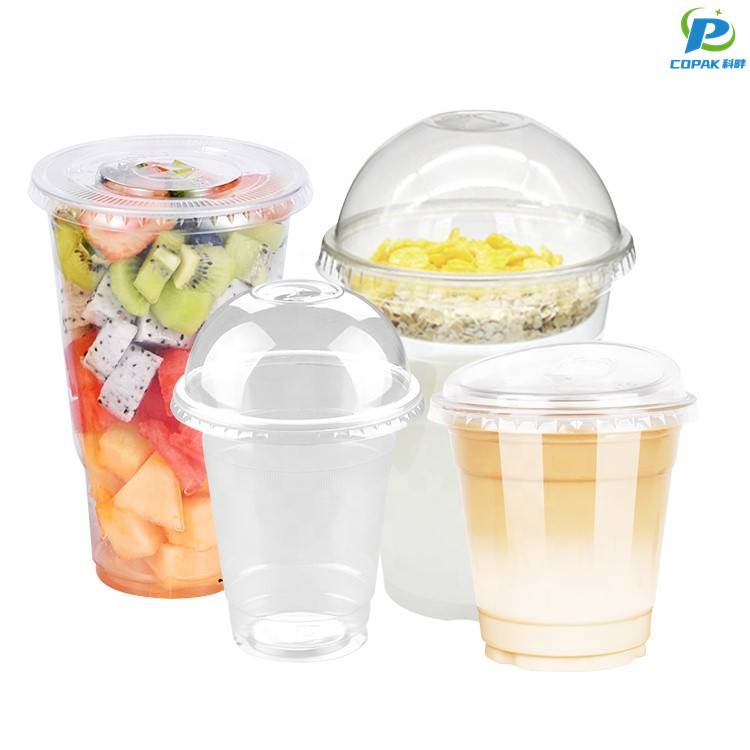


PET Cup Manufacturer For the Current Year Sets the Industry Standard
This year’s leading PET cup manufacturer is redefining industry standards with a blend of advanced production technology, stringent quality control, and sustainable materials. Food-grade PET formulations, upgraded injection/stretch-blow lines, and automated inspection ensure consistent clarity, strength, and safety across high-volume runs. Innovative options such as recycled PET (rPET), lightweighting, barrier enhancements, and full-color printing meet modern demands for performance and brand differentiation. For global buyers seeking reliable supply, the new standard emphasizes traceable raw materials, international certifications, flexible customization, and resilient logistics. Competitive pricing, low MOQs for tailored runs, responsive sample services, and ongoing technical support make it easier to scale product launches while aligning with environmental and regulatory expectations worldwide.
| Cup Type | Material Grade | Recyclability / rPET | Capacity (ml) | Wall Thickness (mm) | Manufacturing Process | Typical Use Cases | Dimensional Tolerance | Surface Finish | Color Options | Temperature Range (°C) | Notes |
|---|---|---|---|---|---|---|---|---|---|---|---|
| Standard Clear PET Cup (Single-wall) | PET (Virgin), Food-grade, Code 1 | Widely recyclable (Code 1); rPET content: 0% | 200 (6.8 oz) | 0.18 | Thermoforming (sheet) | Cold beverages, iced coffee, soft drinks | ±0.25 mm | High gloss | Clear, light tint | -20 to 60 | Not microwave-safe; standard disposable use |
| Tall Cold Drink PET Cup (Tumbler-style) | PET with common 30% rPET option | Curbside recyclable; typical rPET: 30% | 473 (16 oz) | 0.22 | Thermoforming / ISBM (for rigid variants) | Soft drinks, iced tea, smoothies (cold) | ±0.30 mm | Gloss or embossed | Clear, smoked, light green | -20 to 60 | Designed for lids with straw slots; condensation control |
| Double-wall Insulated PET Cup | Multi-layer PET (inner/outer PET), 40% rPET common | Recyclable but separation may be required; rPET ~40% | 350 (12 oz) | Outer 0.30 / Inner 0.25 | Thermoforming with vacuum forming / multi-step assembly | Cold drinks requiring thermal insulation, reduced condensation | ±0.50 mm | Matte or satin; frosted options | Frosted, clear | -20 to 70 | Better stiffness and hand-feel; not for hot liquids |
| Clear PET Deli Cup (Wide-mouth) | PET (Virgin), food-contact grade | Recyclable (Code 1); low rPET typical | 250 (8 oz) | 0.20 | Injection molding or thermoforming (sheet) | Salads, desserts, condiments, cold deli items | ±0.40 mm | High gloss | Clear, opaque white | -20 to 60 | Wide mouth for easy filling and scooping; chilled use only |
| Thick-Wall Premium PET Cup | Higher gauge PET; often 50% rPET feasible | Recyclable; higher rPET content achievable (up to 50%) | 300 (10 oz) | 0.40 | Injection molding for premium stiffness | Premium cold beverages, specialty drinks | ±0.35 mm | High gloss, premium clarity | Clear, tinted | -20 to 70 | Improved rigidity and presentation for retail displays |
| PET with PLA Coating (Eco-look) | PET substrate + PLA surface coating (appearance of compostable) | Coating reduces standard recycling; specialized streams required | 200 (6.8 oz) | 0.18 | Thermoforming followed by coating / lamination | Single-use cold beverages with eco-label appearance | ±0.50 mm | Semi-matte or satin | Frosted, clear | -10 to 50 | Not home-compostable; verify local industrial composting and recycling |
Related Products
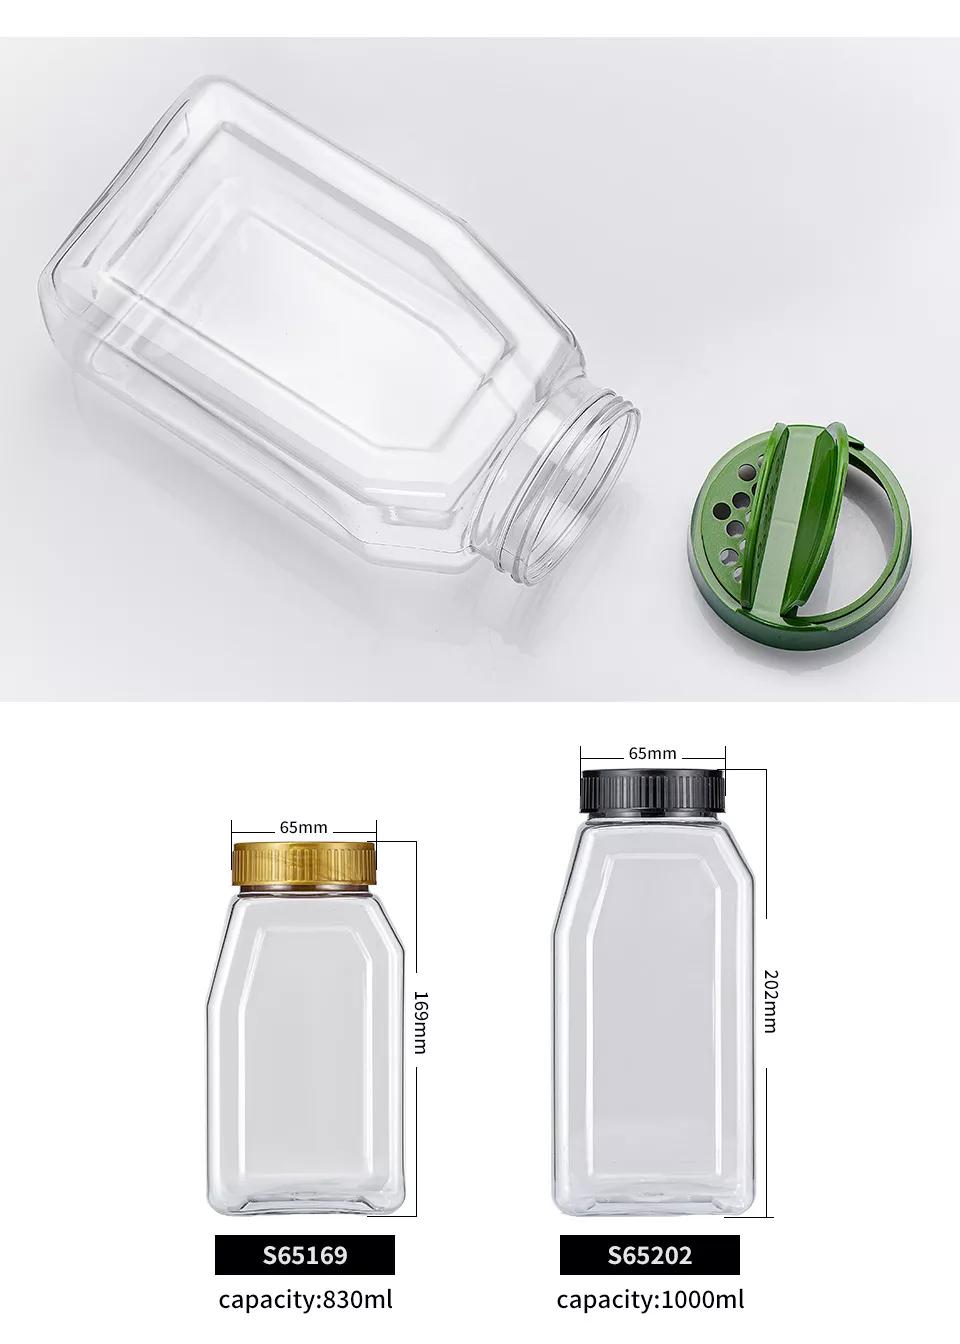
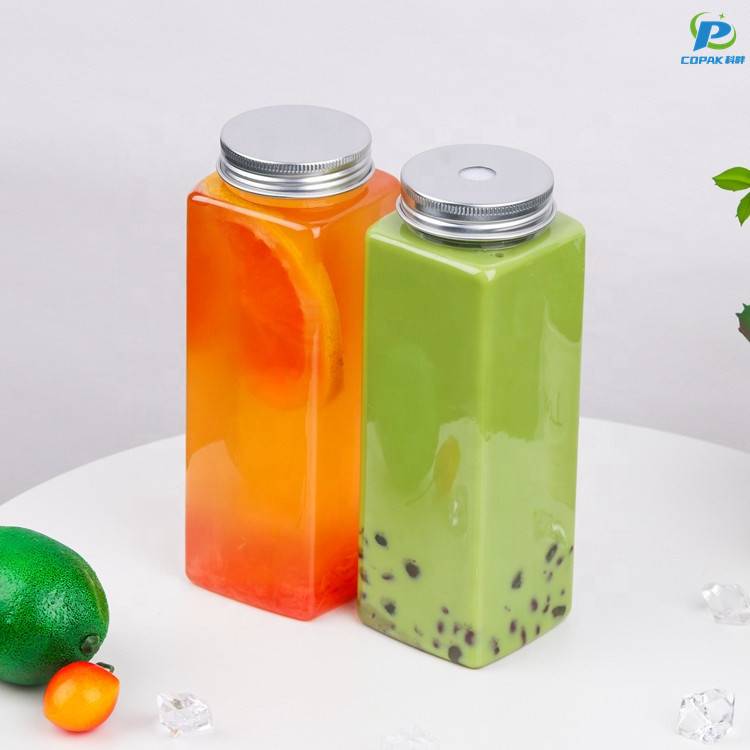
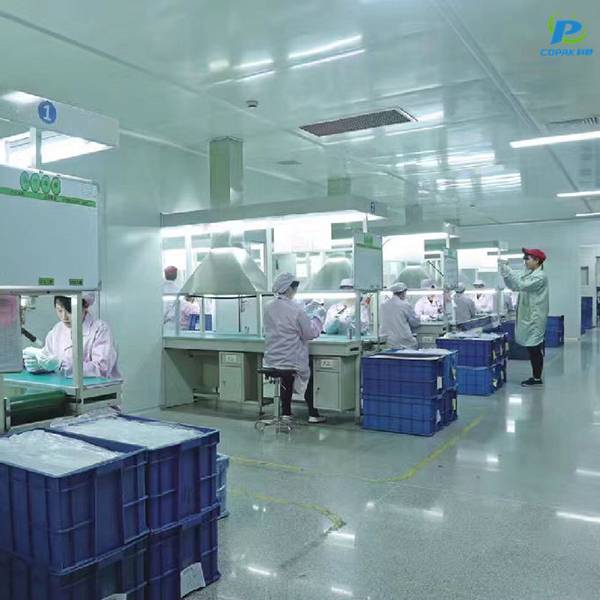


PET Cup Manufacturer Guarantees Peak Performance Factory-Direct Excellence
Shift-Level Performance Snapshot: Throughput, Quality, Yield, and Energy
Top Selling Products





- Related Blog
- Reviews
- Reviews
