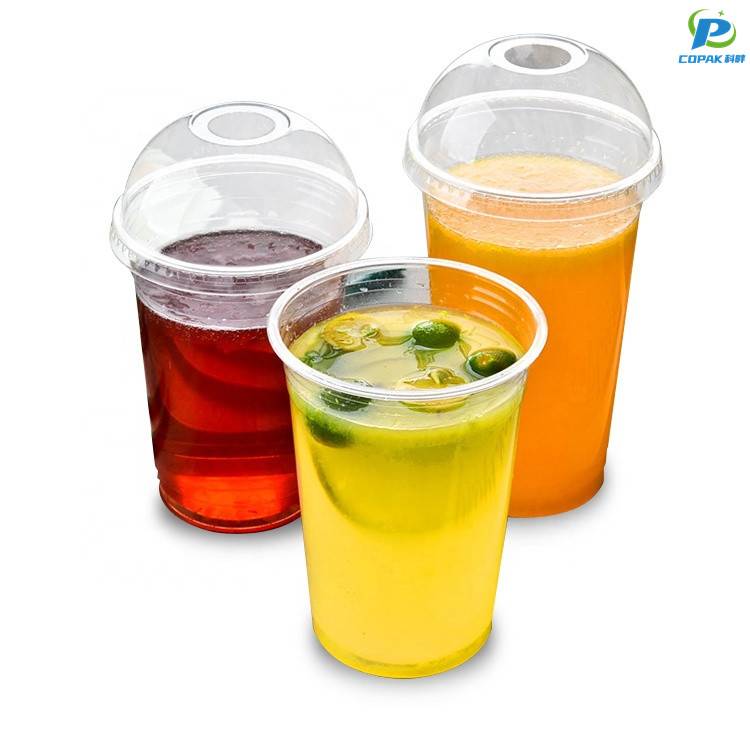
We offer a PET Plastic Can that meet strict market demands. Based in China, we are a Manufacturer that delivers reliable, cost-effective containers for food, beverage, cosmetics, or chemicals. The PET Plastic Can is lightweight, shatter resistant, and offers excellent barrier properties, keeping contents fresh longer. Transparent body helps product visibility, while our range includes multiple sizes, neck finishes, and compatible closures. We customize labeling, printing, and sealing options to fit your brand. With FDA/REACH guidance and food-grade resin, you can trust safety. Our MOQ is flexible for trial runs and volume orders. Fast lead times, stable supply, and dedicated logistics support ensure your timelines. Partner with us for sustainable packaging; PET is recyclable, and we align with circular economy goals. As a China Manufacturer, we understand your need for reliable supply and competitive price. Let us help you scale with confidence.
PET plastic cans have risen to the forefront of global packaging by combining lightweight durability, excellent barrier performance and premium presentation. Engineered for beverages, food, personal care and chemical products, these cans deliver aroma and freshness retention comparable to traditional metal or glass while significantly reducing shipping costs and breakage risk. High clarity, printable surfaces and a variety of neck finishes make them ideal for brand differentiation and shelf appeal. Advanced production lines, strict food-grade materials, and international quality certifications ensure consistent lot-to-lot performance for large-volume buyers. Flexible customization options—size, color, barrier layers, and tamper-evident closures—support private-label and OEM projects, while attentive quality inspections and supply-chain planning guarantee on-time global shipments. For procurement teams focused on cost-efficiency, sustainability and dependable supply, modern PET cans represent a strategic choice: recyclable, lighter-carbon-footprint packaging that preserves product integrity and enhances consumer experience, backed by scalable manufacturing and responsive logistics tailored for international markets.
| Metric / Property | Global | Europe | North America | Asia Pacific | Latin America | Middle East & Africa |
|---|---|---|---|---|---|---|
| Estimated PET Share in Rigid Packaging (%) | 35% | 40% | 32% | 36% | 30% | 28% |
| 5‑Year CAGR (2021–2026) for PET Cans (%) | 4.2% | 3.5% | 3.8% | 5.0% | 4.0% | 3.2% |
| Post‑Consumer Recovery Rate (Recyclability, 2023 est.) | 40% | 60% | 29% | 35% | 25% | 20% |
| Average rPET Content in Packaging (typical) | 20% | 35% | 20% | 10% | 8% | 5% |
| Typical Density | 1.38g/cm³ | 1.38g/cm³ | 1.38g/cm³ | 1.38g/cm³ | 1.38g/cm³ | 1.38g/cm³ |
| Melting Point (approx., crystalline) | 250°C | 250°C | 250°C | 250°C | 250°C | 250°C |
| Typical Wall Thickness — Can Body (range, typical) | 0.30mm | 0.28mm | 0.32mm | 0.30mm | 0.35mm | 0.40mm |
| Cradle‑to‑Gate GHG (approx., virgin PET) | 2.4kg CO2e/kg | 2.2kg CO2e/kg | 2.6kg CO2e/kg | 2.8kg CO2e/kg | 2.5kg CO2e/kg | 2.9kg CO2e/kg |