PET Bottles

PET Beverage Cup - China Manufacturer for Premium PET Cups

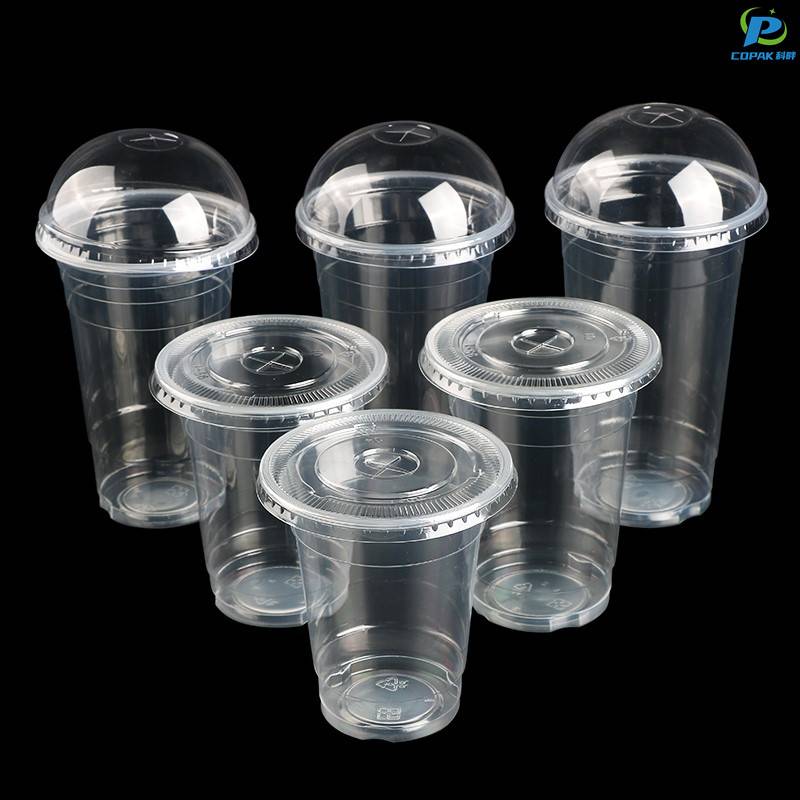
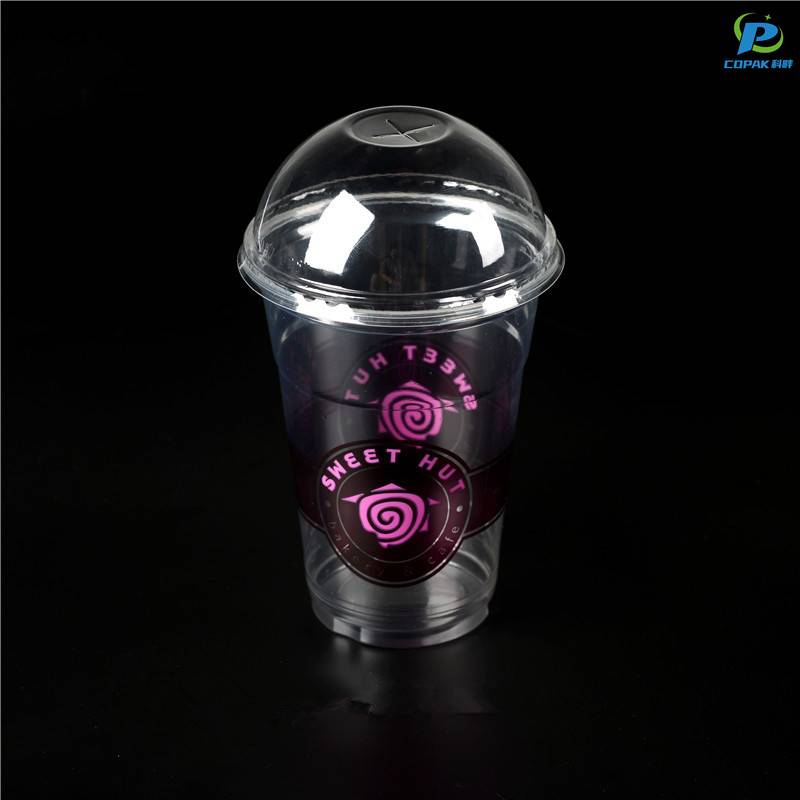
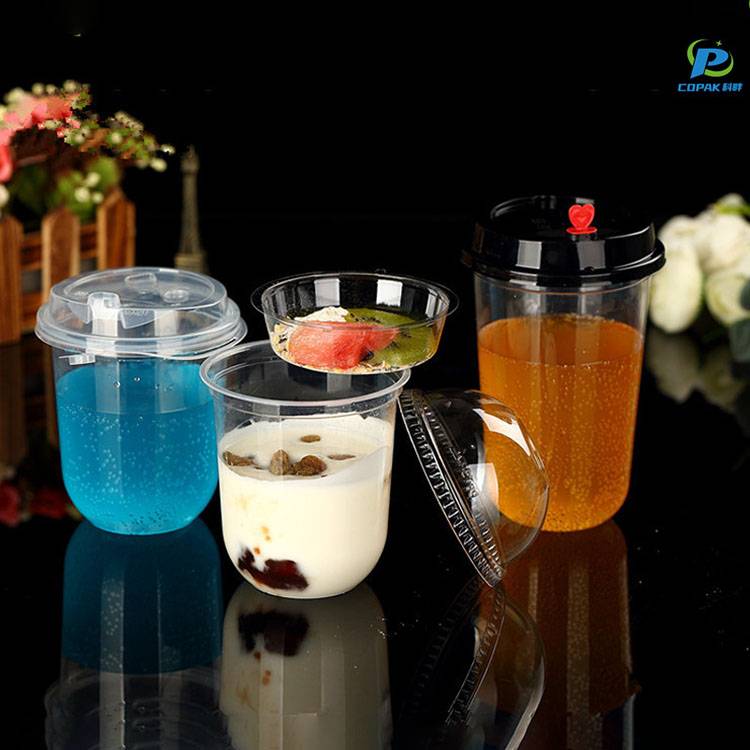
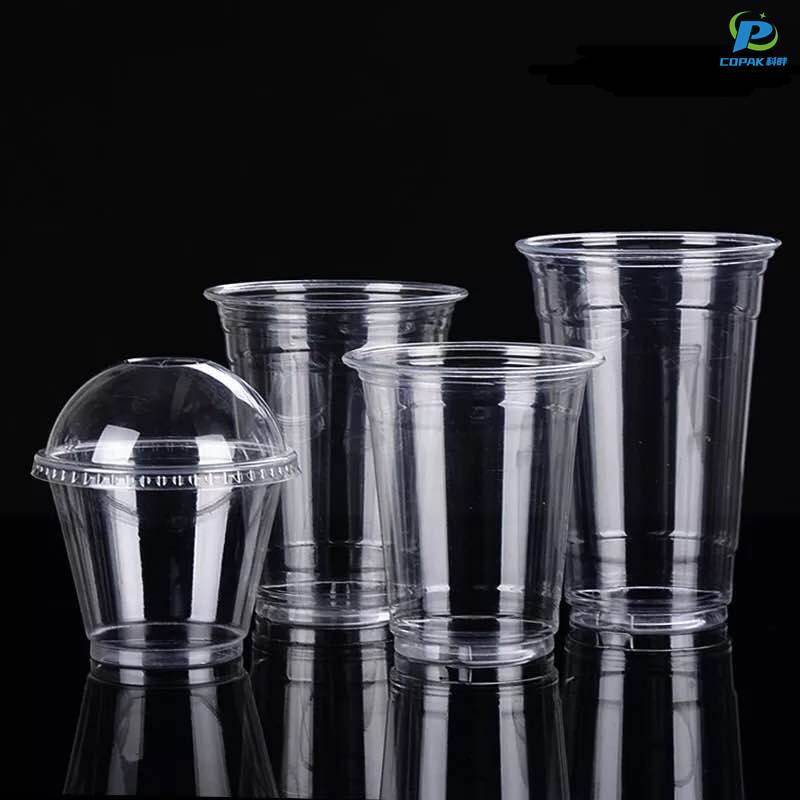
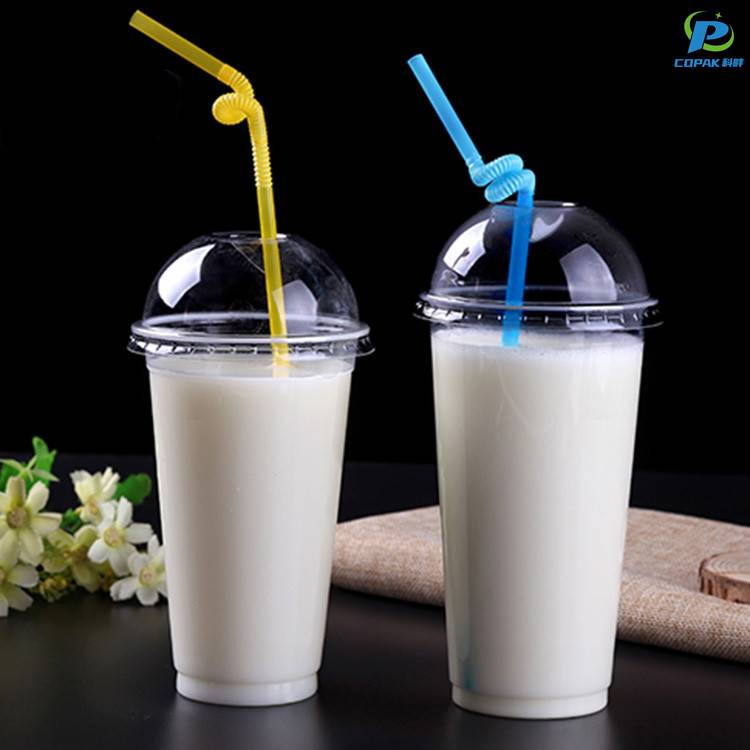
As a China-based Manufacturer, we offer the {PET Beverage Cup} family for B2B buyers who demand reliability and value. I source food-grade PET, BPA-free and crystal clear, to ensure beverage appeal and safety across cafés, convenience stores, and catering services. Our cups pair with a snug lid and standard straws, delivering leak resistance for cold drinks from coffee to fruit juice. We provide customization: logo, colors, and packaging options to fit your branding and logistics. We can scale from pilot runs to large orders, with competitive MOQs and rapid lead times. The cups are recyclable, supporting sustainability goals while keeping costs down. We ship with clear documentation and compliant certifications, making import to your market smooth. If you’re a B2B purchaser in need of a dependable, China-produced, Manufacturer-backed cup solution, let’s collaborate to grow your product line with confidence.

Hot Selling Product

PET Beverage Cup Dominates From Concept to Delivery

From concept to delivery, PET beverage cups lead the market by combining lightweight clarity, durable performance and full customizability. Designers and brand owners benefit from a wide range of options—clear or frosted finishes, rPET content for circularity, barrier treatments for shelf stability, and precision printing or labeling for standout shelf appeal. Molded ergonomics, tamper-evident lids and stackable features ensure product safety and retail efficiency while meeting global food-contact standards. A streamlined production-to-shipment process guarantees consistent quality and on-time fulfillment for international buyers: rapid prototyping and sample approval, stringent QC at each stage, scalable mass production, and compliant documentation (FDA/EU-ready). Flexible MOQ, optimized packaging for freight savings, and experience with cross-border logistics help reduce lead times and costs. For brands seeking reliable, sustainable beverage packaging solutions, this end-to-end approach turns concepts into market-ready products.

PET Beverage Cup Dominates From Concept to Delivery
Attribute Typical Specification Unit / Range Measurement / Method Notes / Compliance
Material Polyethylene terephthalate (PET), transparent amorphous or oriented sheet Material spec sheet; DSC for Tg/crystallinity Meets typical food-contact polymer requirements where specified
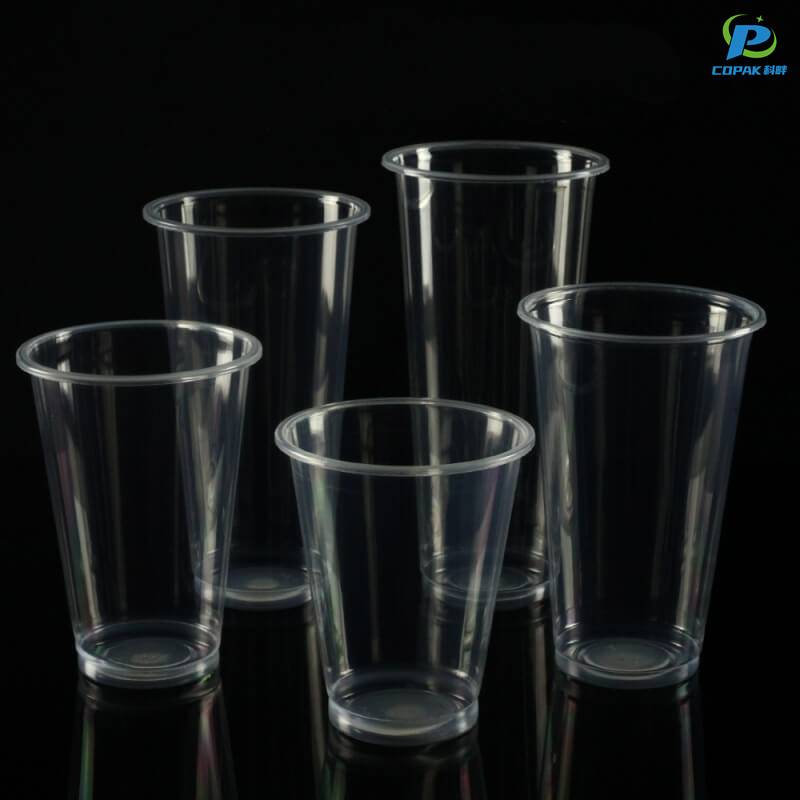
Capacity (common sizes) Small, Medium, Large (examples) 200 ml / 300–350 ml / 500–750 ml Volume measurement (graduated cylinder) Designs optimized for stackability and lid fit
Typical Mass (single cup) Lightweight thermoformed sheet cup 3.5–12 g per cup (varies by size & gauge) Precision balance (0.1 mg resolution) Lower mass for single-use cold beverages; heavier for lids/rigidity
Manufacturing process Thermoforming from PET sheet; also injection molding for specialized cups Cycle time: 1–8 s per cavity (high-speed lines) Line throughput measurement; SPC on cycle time Thermoforming common for thin-wall clear cups
Barrier performance (O2) Monolayer PET vs. multilayer with barrier Monolayer: ~1–5 cm3/m2·day·atm; Multilayer/EVOH: <0.1 cm3/m2·day·atm Oxygen transmission rate test (ASTM F1927 / ISO 15105) Multilayer needed for extended shelf life or oxygen-sensitive drinks
Moisture transmission (WVTR) Typical for PET sheet cups ~0.5–3 g/m2·day (depending on thickness & coating) WVTR test (ASTM F1249 / ISO 15106) Critical for products requiring flavor stability
Recommended filling temperature Ambient to chilled; limited hot-fill capability Cold to ~60°C (hot-fill up to ~85°C only with crystallized PET) Thermal cycling and deformation tests Hot-fill requires material and design adjustments
Regulatory / Food contact Compliant with common food-contact regulations Reference: applicable national/international food-contact rules Migration testing (overall and specific migration) Documentation and certificates required per market
Print & Decoration Direct printing and labels Methods: screen, flexo, UV, digital transfer Adhesion tests; rub resistance Ink formulants must be food-safe where applicable
Sustainability indicators Recyclability & recycled content Typical rPET content: 0–30%; recyclability: high in PET streams End-of-life analysis; recycling stream compatibility Design for mono-PET improves recycling capture
Cradle-to-gate carbon footprint (estimate) Based on material and process energy ~15–35 g CO2e per cup (typical 3–12 g mass, process included) LCA modeling (ISO 14040/44 methodology) Varies by rPET content, energy mix & transport
Typical applications Cold beverages, iced coffee, smoothies, prepacked chilled foods Ambient-chilled distribution chains Application testing (drop, lid fit, carbonation) Carbonated drinks require appropriate lid & headspace control
Color & finish options Clear, tinted, opaque; glossy or matte finish Visual and spectrophotometric color control Tinting affects recyclability sorting if mixes multiple pigments
Quality control & acceptance Dimensional, visual, functional tests Seal integrity, rim dimensions, stackability IQ/OQ/PQ routines, sample testing per batch Traceable lot records recommended

Related Products

Eco Friendly Products

PET Beverage Cup Now Trending Delivers Unmatched Quality

Monthly Quality and Consumer Interest Trends for PET Beverage Cups

This chart presents a synthesized, month-by-month view of three complementary metrics around PET beverage cups: a Quality Index (0–100), Consumer Interest Score (0–100), and Defect Incidence (measured as defects per 1,000 units, shown on a secondary axis). Over a one-year window, the data reflects steady improvements in manufacturing consistency and market perception. The Quality Index climbs from the mid-70s to the low-90s, indicating incremental process optimizations such as material consistency, molding precision, and post-production inspection. Consumer Interest tracks a similar upward trajectory, rising from 60 to the mid-80s; this implies that enhancements in perceived product value, sustainability messaging, and point-of-sale visibility are correlating with market demand. In contrast, Defect Incidence declines markedly from around 5 defects per 1,000 units to roughly 2.4 — a strong signal that quality control interventions are effective and reducing waste and returns. Viewing these three series together highlights relationships: declines in defect rates align temporally with increases in both Quality Index and Consumer Interest, suggesting causality or at least strong correlation between improved manufacturing outcomes and consumer response. The dual-axis layout allows direct comparison of normalized scores with a small-scale defect metric without misrepresenting trends. Practical takeaways include prioritizing continued investment in process control technologies, targeted consumer communications that emphasize measurable quality gains, and ongoing monitoring of defect drivers (e.g., material batch variation, tooling wear). This visualization can support monthly operations reviews, guide capital allocation toward the most impactful quality improvements, and serve as a communication piece for cross-functional teams tracking product performance metrics. Regular updates with real production data will refine trend responsiveness and help prioritize corrective actions earlier in the production cycle.

Top Selling Products

Subscribe To Our Newsletter

For inquiries about our products or pricelist, please leave your email to us and we will be in touch within 24 hours.

Follow Us

on our social media
  • whatsapp (1)
  • instagram
  • youtube