




PLA Cold Cups Manufacturer in China | High-Quality PLA Cold Cups
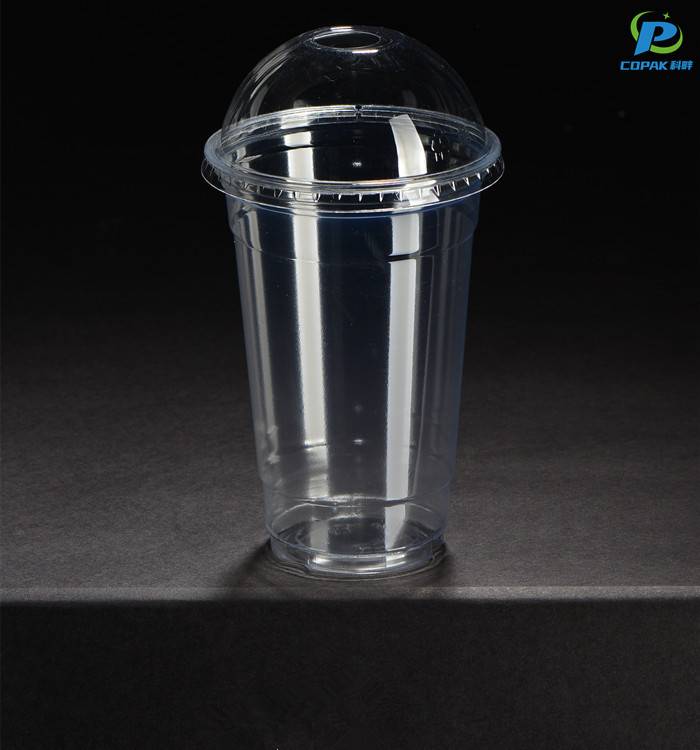
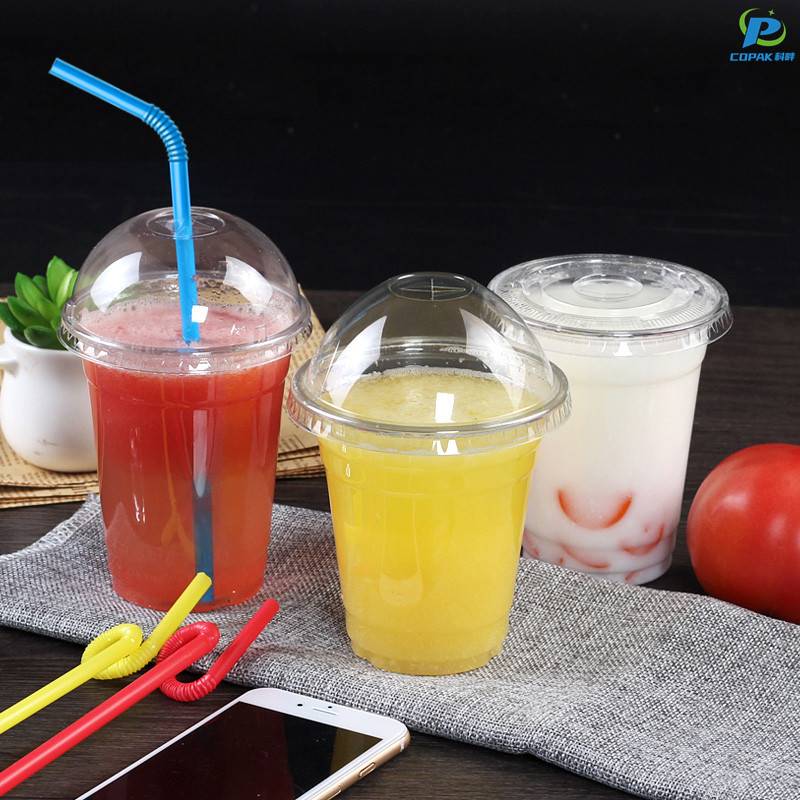
Working as a China-based manufacturer, I supply PLA Cold Cups designed for quick-service restaurants, coffee shops, and event suppliers. Our PLA Cold Cups deliver clear branding and reliable strength while staying environmentally friendly. I use food-grade PLA resin, from China or certified suppliers, to ensure safe contact with beverages. The cups are compostable under industrial conditions, reducing waste and aligning with CSR goals. They come in a range of sizes, compatible with standard lids, easy to stack, leak resistant, and printable with your logo. I can offer customization in volume, colour, and branding, with quick lead times and competitive pricing. You get reliable supply, consistent quality, and packaging that protects the cups during shipment. As a firmly established Manufacturer in China, I drive strict QC, ensure batch traceability, and provide flexible MOQ. If you want eco-friendly beverage packaging that doesn't compromise performance, contact me to discuss your needs and we will tailor a solution.


PLA Cold Cups Products Global Reach
PLA cold cups are rapidly becoming the global procurement choice for brands seeking a high-performance, compostable alternative to traditional PET. Featuring clear optics, sturdy walls, grease resistance and compatibility with a range of lids, PLA cups suit iced coffee, smoothies, bubble tea and ready-to-drink retail lines. Custom options for size, thickness, printing and anti-fog or barrier treatments allow differentiation while maintaining compliance with food-contact and compostability standards required in major markets. For global buyers, advantages include scalable production capacity, consistent quality control, competitive pricing and streamlined logistics to support multi-country distribution. Choosing PLA cold cups helps meet corporate sustainability targets and appeals to eco-conscious consumers, while flexible minimums, reliable lead times and tailored packaging make integration into existing supply chains straightforward. Collaboration on specification, sampling and long-term planning ensures product performance and brand alignment across markets.
{ PLA Cold Cups Products Global Reach}
| Region | Representative Countries | Annual Export Volume (tons) | Primary Product Types | Typical PLA Composition (%) | Common Certifications | Avg Lead Time (weeks) | Typical Applications | Local Compost/Recycling Infrastructure |
|---|---|---|---|---|---|---|---|---|
| North America | United States, Canada, Mexico | 30,000 | Cold beverage cups (8–24 oz), lids, portion cups | PLA 95% / Additives 5% | ASTM D6400, BPI, EN 13432 (imported recognition) | 6–10 | Cold drinks, smoothies, takeout catering | Medium — industrial composting available in metropolitan regions |
| Europe | Germany, France, Netherlands, Spain, Italy | 25,000 | Cold cups (8–16 oz), double-walled cold cups, compostable liners | PLA 92–100% | EN 13432, OK Compost INDUSTRIAL, TÜV | 4–8 | Cold beverages, events, horeca (hotel/restaurant/cafe) | High — extensive industrial compost networks in Western Europe |
| East Asia | Japan, South Korea, Taiwan | 15,000 | Clear PLA cold cups, dome lids, portion cups | PLA 90–98% | EN 13432 (export recognition), regional compost standards | 3–7 | Cold beverages, dessert cups, retail chains | Medium — growing industrial composting; strong private collection pilots |
| Southeast Asia & Oceania | Australia, New Zealand, Thailand, Vietnam | 7,000 | Cold cups, takeaway portion cups, cafe use | PLA 85–95% (blended for heat resistance) | EN 13432, local certifications, OK Compost for Australia/NZ | 5–9 | Street food, cafes, takeaway services | Variable — high in Australia/NZ, low–medium in parts of SE Asia |
| Latin America | Brazil, Chile, Colombia | 3,000 | Cold cups, promotional event packs | PLA 88–95% | EN 13432 (recognition), regional test marks | 8–12 | Cold drinks, community events, small chains | Low–Medium — limited industrial composting; pilot programs emerging |
| Middle East & North Africa | UAE, Saudi Arabia, Egypt | 2,500 | Clear cold cups, event cups | PLA 90–96% | EN 13432 (imported recognition), regional conformity marks | 6–10 | Hospitality, events, retail chains | Low — few industrial composting facilities; emphasis on waste-to-energy |
| Sub-Saharan Africa | South Africa, Kenya, Nigeria | 1,200 | Basic cold cups, disposable portion cups | PLA 80–92% (cost-optimized blends) | Limited local certification; reliance on international standards | 10–14 | Street vendors, small cafes, markets | Low — minimal industrial composting; informal waste systems predominate |
| South Asia | India, Bangladesh, Sri Lanka | 4,000 | Cold cups, disposable beverage containers | PLA 85–95% | EN 13432 recognized; few local certification labs | 8–12 | Street food, cafes, packaged beverage events | Low — composting infrastructure developing; urban pilot projects |
Related Products


PLA Cold Cups Now Trending Your End-to-End Solution
Top Selling Products







- Related Blog
- Reviews
- Reviews
