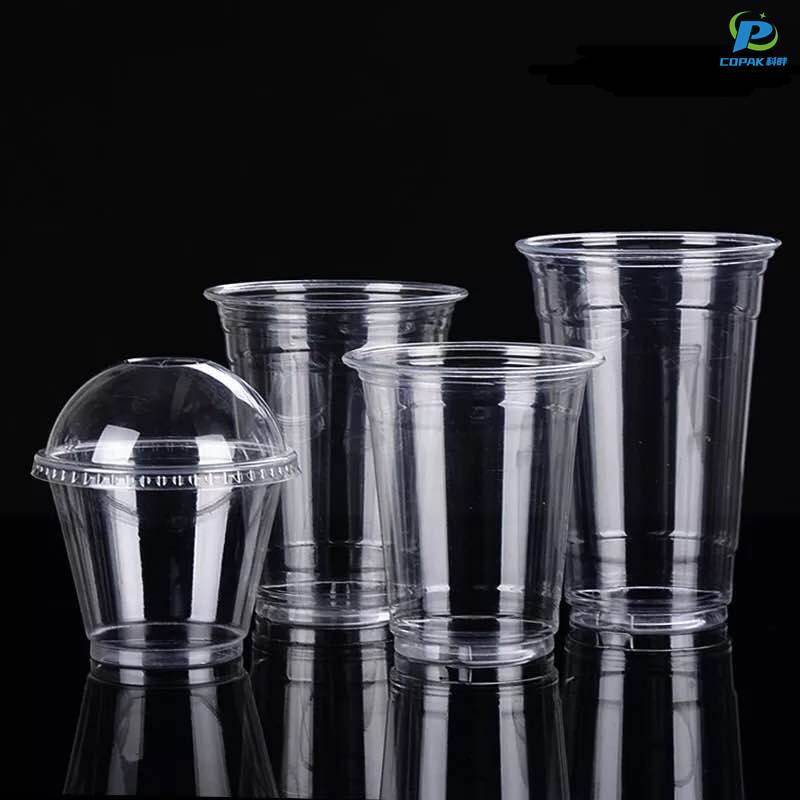
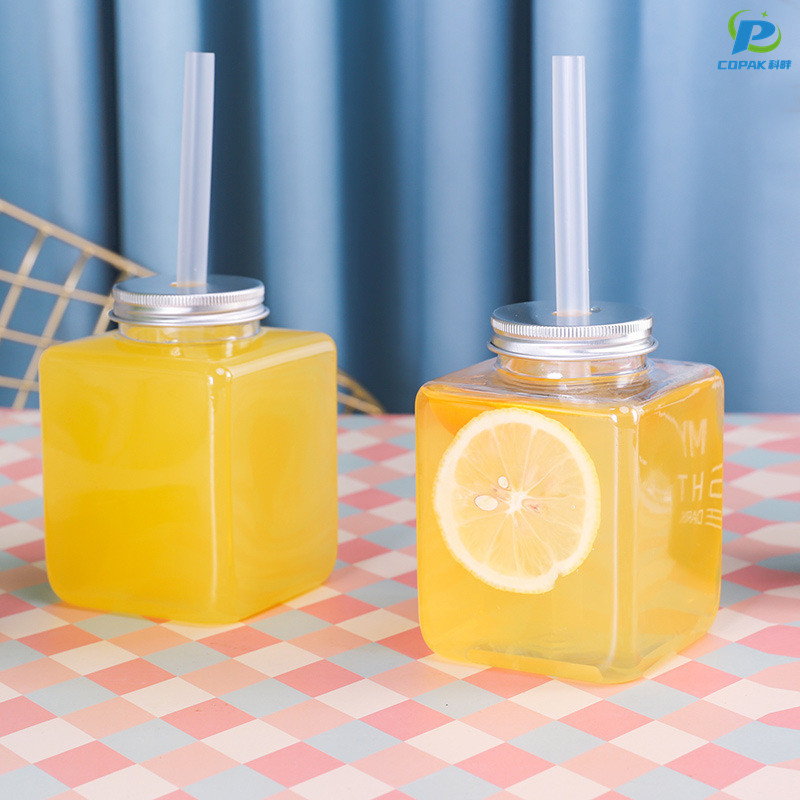
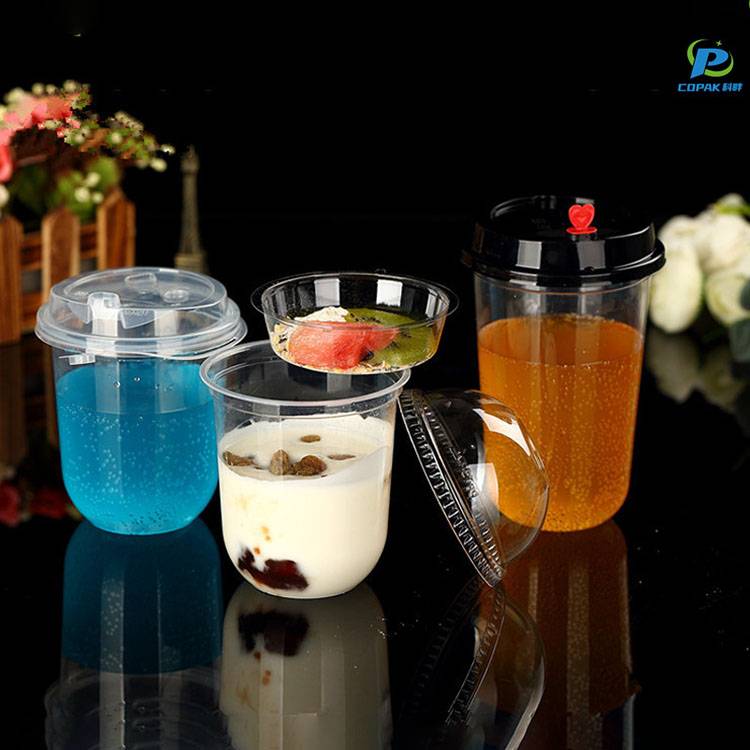
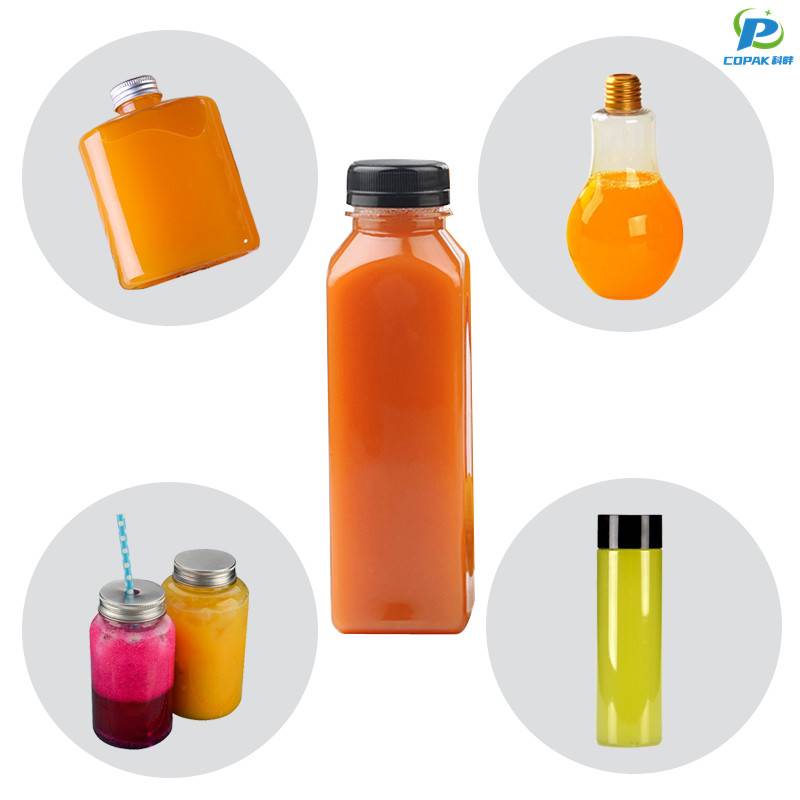
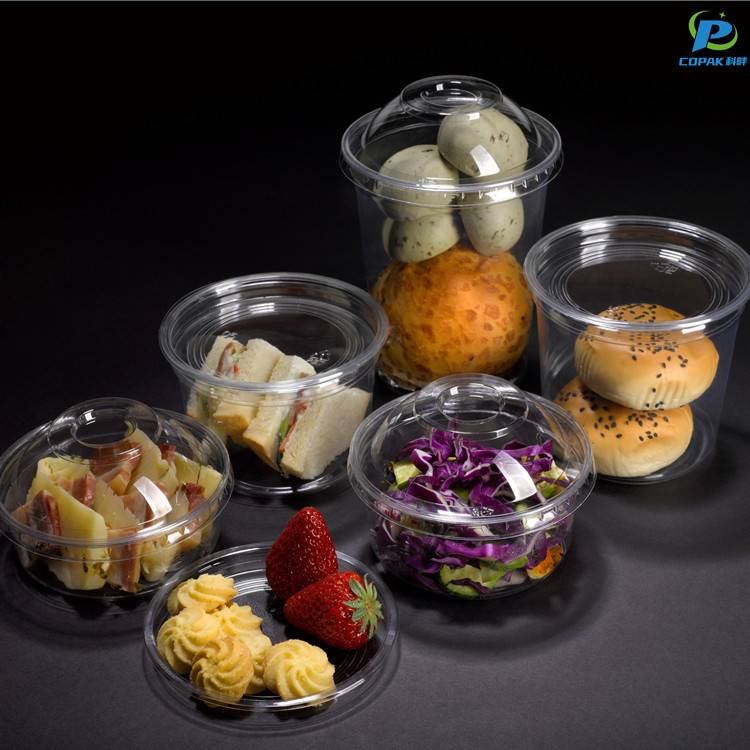
From my perspective as a PLA Cups China supplier, I offer reliable, compostable cup solutions for food service and events. In China, buyers look for sustainable packaging that fits their brand, and I’m your Manufacturer who can deliver high‑quality PLA cups with consistent wall thickness and leak resistance. Our PLA Cups China range includes compostable cups for hot and cold beverages, grease resistance, and suitability for vending or to‑go service. I use food‑grade PLA and provide customization options and bulk pricing for large orders. With fast lead times, scalable production, and strict quality control, you can count on me to ship on time to your warehouse. If sustainability matters to your clients, these PLA Cups China are a smart choice. They’re designed for mass consumption, easy recycling, and strong performance through transport and service.
China’s PLA cups are setting the pace in sustainable single-use tableware, combining plant-based materials with modern manufacturing to meet global demand for eco-conscious alternatives. These cups offer clarity, good heat resistance for both hot and cold drinks, and industrial compostability, helping brands reduce plastic waste while maintaining cost-effectiveness and consistent quality at scale. For international buyers, advantages include flexible customization (sizes, printing, colors, barrier options), robust quality control, reliable lead times, competitive pricing and support for compliance with international food-contact and compostability standards. Samples, technical documentation and logistics solutions are available to streamline sourcing and speed time-to-market.
| { PLA Cups China Ahead of the Curve Pioneers in the Field} | ||||||||
|---|---|---|---|---|---|---|---|---|
| Region / Segment | Typical Feedstock | Typical PLA Content | Compostability Standards Met | Industrial Composting Time | Home Composting Time | Estimated Carbon Footprint (kg CO2e / kg PLA) | Recyclability Notes | Typical Applications |
| Global average | Cereal starches (corn, wheat), cassava, sugarcane‑derived fermentates | 95–100% | EN 13432; ASTM D6400; ISO 17088 (commonly certified) | 6–12 weeks | 6–24 months (often incomplete in home systems) | 1.2–2.0 | Limited closed‑loop mechanical recycling; industrial compost streams preferred; chemical recycling emerging | Disposable cups/containers, films, fibers, 3D printing filament |
| Asia‑Pacific | Cassava, corn; increasing use of local starches | 90–100% | EN 13432; ASTM D6400 commonly used for export controls | 6–10 weeks | 6–18 months | 1.1–1.8 | Industrial composting infrastructure growing; mechanical recycling limited | Takeout cups, molded containers, cutlery |
| Europe | Wheat, corn, sugar beet derivatives | 95–100% | EN 13432 widely applied; ISO 17088 | 8–12 weeks | 12–24 months | 1.3–2.0 | Relatively widespread industrial composting; pilots for chemical recycling | Tableware, retail packaging, horticultural pots |
| North America | Corn (maize) predominant | 95–100% | ASTM D6400; EN 13432 recognized | 6–10 weeks | 6–18 months (highly variable) | 1.2–2.1 | Municipal compost availability varies; mechanical recycling limited to niche streams | Beverage cups, foodservice items, 3D printing filament |
| South America | Sugarcane derivatives, cassava | 90–100% | Increasing certification to EN 13432 / ASTM | 6–10 weeks | 6–18 months | 1.0–1.7 | Composting programs expanding regionally; recycling nascent | Packaging film, disposable containers, mulch film |
| 3D‑printing grade | Purified lactic acid from starch fermentation; high‑purity PLA | 98–100% (additive‑free grades common) | Certification less common for filament; ISO 17088 referenced in some cases | N/A (large/solid prints degrade slowly) | N/A (geometry limits home decomposition) | 1.3–1.8 | Filament reuse/re‑melting possible for hobby scale; commercial recycling limited | Prototyping, hobbyist parts, educational models |