




Transparent Disposable Cups - China Manufacturer for Quality Solutions
We’re a China-based manufacturer of Transparent Disposable Cups, dedicated to meeting the needs of distributors, retailers, and foodservice operators. I know that in B2B buying, reliability and price-per-portion matter most, so we engineered these cups to perform under busy service while keeping costs low. Transparent Disposable Cups feature crystal-clear clarity, food-grade PET/PP material, and a snug leak-resistant rim that minimizes spills. They’re designed to be stackable for easy storage and compatible with common lids and straws, making them versatile for coffee, cold beverages, or samples. We offer flexible options: multiple sizes, customizable branding, and OEM/ODM packaging to suit your market. All cups meet food-contact safety standards and are produced in a ISO-certified facility for consistent quality. Lead times are short and MOQ is buyer-friendly. If you’re sourcing China manufacturers for dependable supply, I’m here to help you lock in steady supply and fast reorders. Let’s talk about your project and samples.


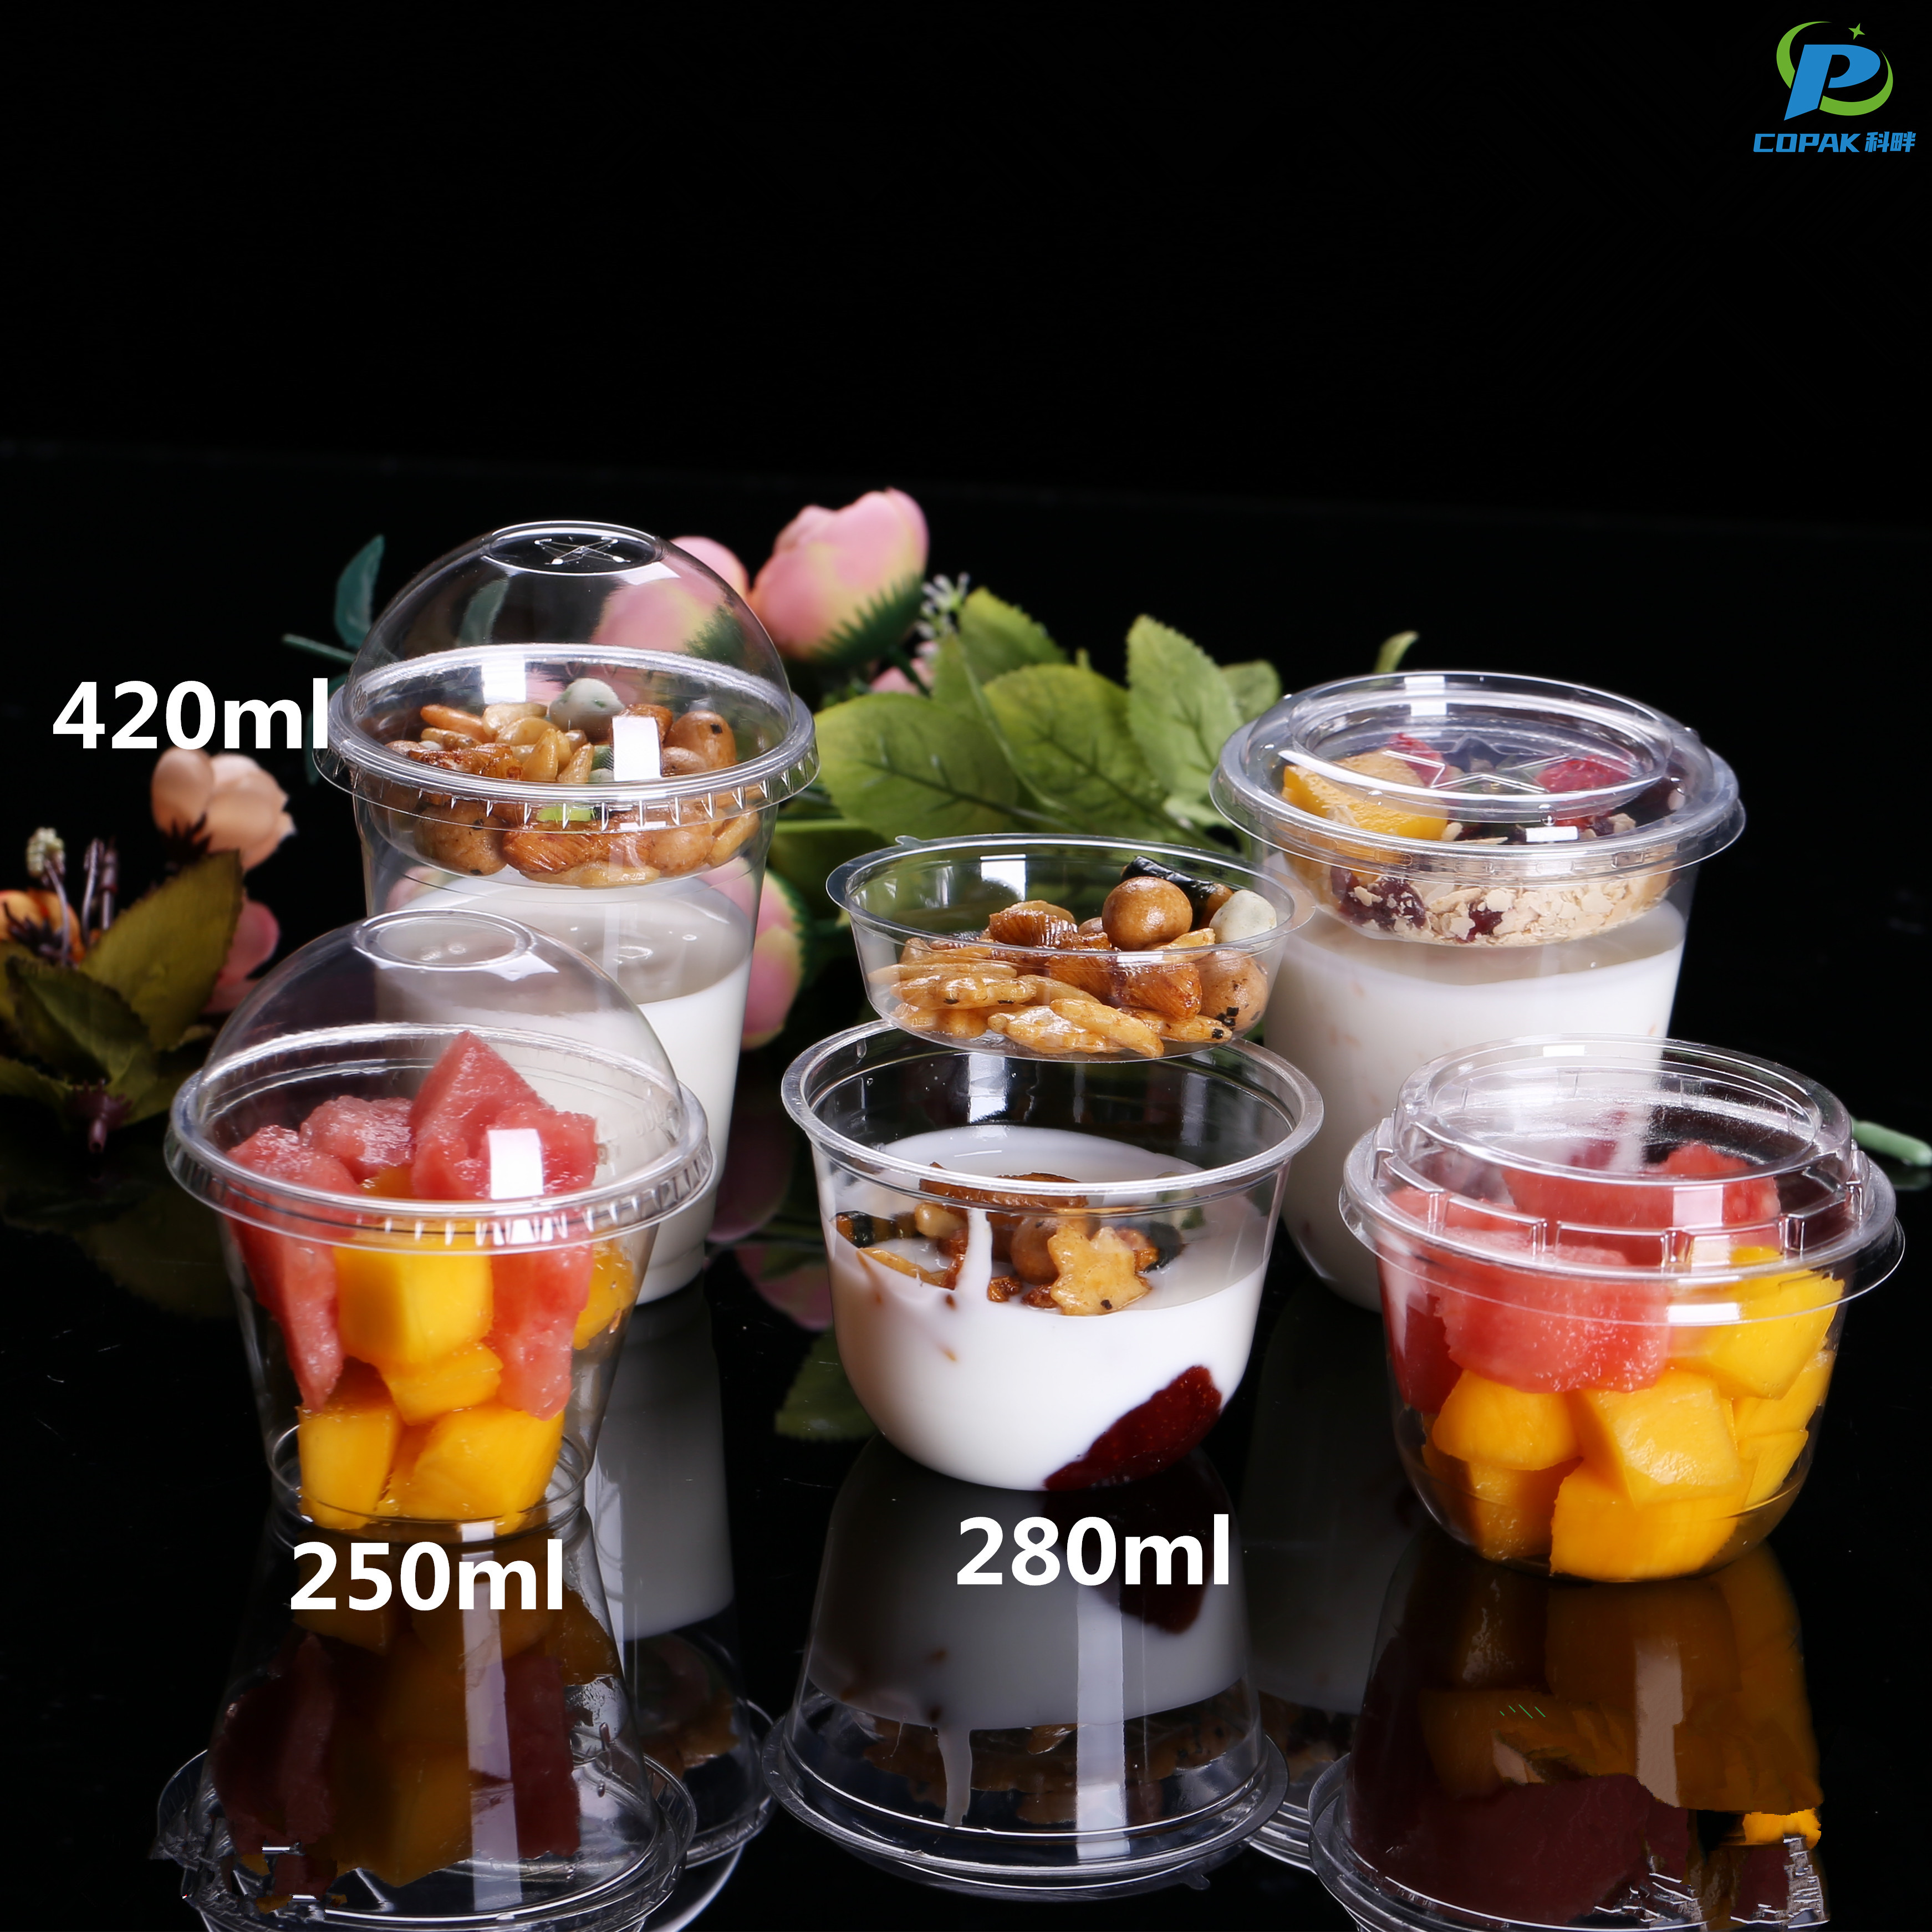
Transparent Disposable Cups For the Current Year From Concept to Delivery
Transparent disposable cups have become a vital part of today’s food and beverage industry, offering both clarity and convenience. From initial concept, these cups are designed with user experience in mind, emphasizing durability, transparency, and recyclability. Starting with rigorous material selection, only high-quality PET or PP materials are chosen to ensure the final product meets international safety and environmental standards. The delivery process is streamlined to cater to global supply chain demands. State-of-the-art manufacturing technologies are used to produce a range of transparent disposable cups suitable for various drinks, whether cold juices, smoothies, or iced coffees. Customization options, such as printed logos or unique sizes, meet the needs of businesses seeking both branding and functionality. Packaging and logistics are optimized for bulk orders, ensuring cups arrive intact and on time for events, retail, or hospitality settings worldwide. From concept through to delivery, the entire process focuses on delivering transparent disposable cups that combine quality, versatility, and efficiency for global purchasers.
| Property / Metric | 200 ml | 300 ml | 500 ml | 1000 ml | Notes |
|---|---|---|---|---|---|
| Primary material | PET (Polyethylene terephthalate) | PET | PET | PET | High clarity material commonly used for transparent single-use cups; mechanically recyclable in PET streams. |
| Typical weight per cup (g) | 3.8 g | 5.2 g | 7.8 g | 14.5 g | Measured as produced by thermoforming/injection processes (average values). |
| Typical capacity (ml) | 200 ml | 300 ml | 500 ml | 1000 ml | Standard nominal fill volumes. |
| Height × Diameter (mm) | 95 × 66 | 105 × 80 | 130 × 95 | 165 × 115 | Typical geometry for common beverage service; variations exist by manufacturer tooling. |
| Wall thickness (mm) | 0.16 | 0.18 | 0.20 | 0.28 | Nominal wall thickness; affects stiffness and optical clarity. |
| Light transmission / transparency (%) | 92% | 91% | 90% | 89% | Measured as total visible light transmission for clear PET sheet/cup. |
| Maximum continuous service temperature (°C) | 60 °C | 60 °C | 60 °C | 60 °C | Short-term exposure up to ~70 °C may be tolerated; not microwave-safe. |
| Microwave / freezer suitability | Not microwave-safe / Limited freezer use | Not microwave-safe / Limited freezer use | Not microwave-safe / Limited freezer use | Not microwave-safe / Limited freezer use | PET loses dimensional stability at high heat; chill use acceptable if not subject to impact. |
| Recyclability | Recyclable (PET stream) | Recyclable (PET stream) | Recyclable (PET stream) | Recyclable (PET stream) | Clean, empty cups accepted in many municipal PET recycling programs; local rules vary. |
| Compostability | No | No | No | No | Standard PET is not industrially compostable. |
| Carbon footprint (approx., kg CO2e per 1000 cups) | 9.5 kg CO2e | 13.0 kg CO2e | 19.5 kg CO2e | 36.3 kg CO2e | Estimate based on average material weight × industry emission factor (~2.5 kg CO2e/kg PET). Includes material + basic processing (excludes transport). |
| Typical production speed (cups / min per machine) | ~120 | ~110 | ~90 | ~45 | Rates vary by machine type (thermoforming vs injection) and cavity count. |
| Average defect rate (first-pass yield) | ~0.4% | ~0.5% | ~0.8% | ~1.1% | Typical industry ranges; depends on tooling, material control, and QC standards. |
| Packaging format (typical) | Sleeved bundles → palletized | Sleeved bundles → palletized | Sleeved bundles → palletized | Sleeved bundles → palletized | Packaging optimized for automated handling; inner protective layers to avoid abrasion. |
| Regulatory / food-contact standards commonly met | FDA 21 CFR (food contact); EU Regulation No 10/2011 for plastics; typical manufacturer quality management standards | Compliance should be verified against end-market regulations and migration testing. | |||
| Concept → delivery (median lead time, days) | ~60 days | ~65 days | ~72 days | ~85 days | Includes design/prototyping, testing, tooling, production run and standard domestic shipping; expedited options reduce time but increase environmental impact. |
| End-of-life recommendation | Collect and recycle via PET stream; prefer mechanical recycling; avoid landfill/incineration when possible | Design for recyclability: avoid multi-material laminates, keep labels and inks compatible with PET reclaiming. | |||
| Lid compatibility | Standard snap lid (small) | Standard snap lid (medium) | Standard snap lid (large) | Standard snap lid (x-large) | Lid designs vary; confirm rim geometry and tolerance for secure fit. |
Related Products


Transparent Disposable Cups Trusted by Pros Manufacturers You Can Rely On
Top Selling Products


- Related Blog
- Reviews
- Reviews
