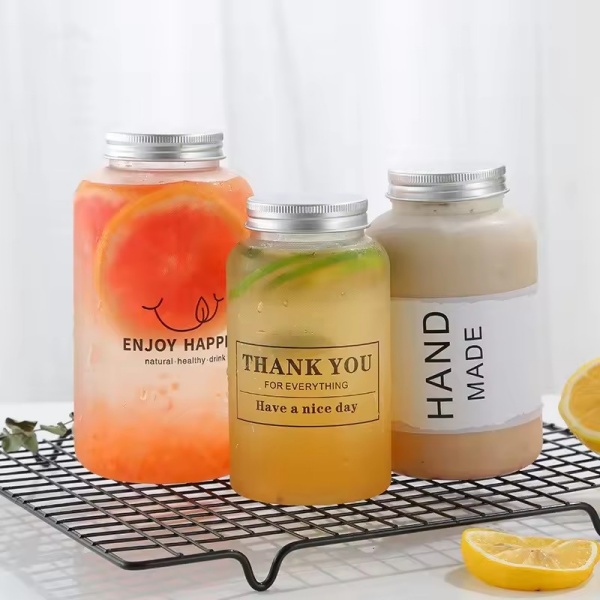
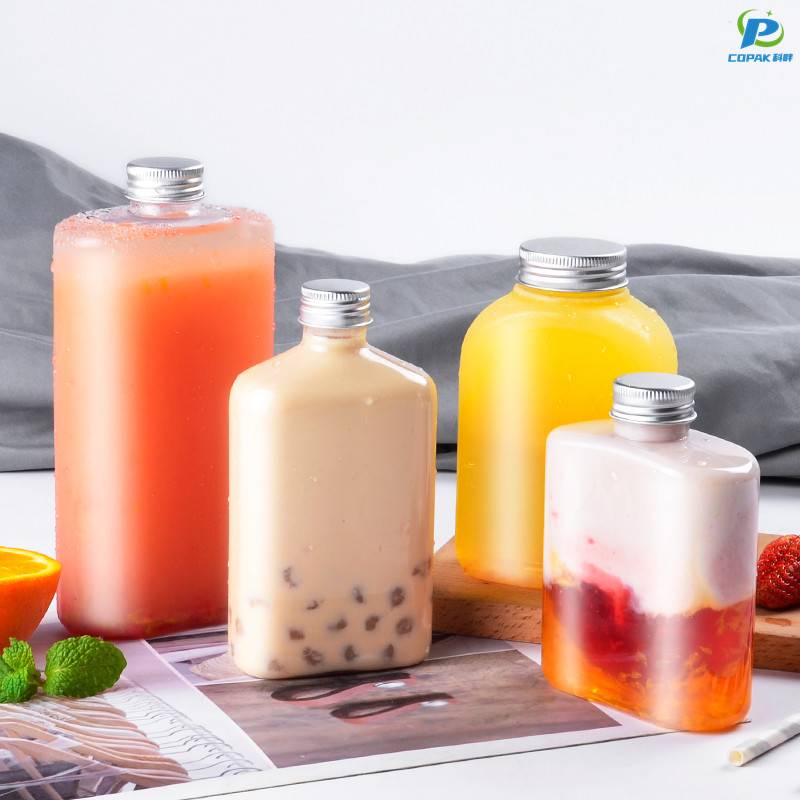
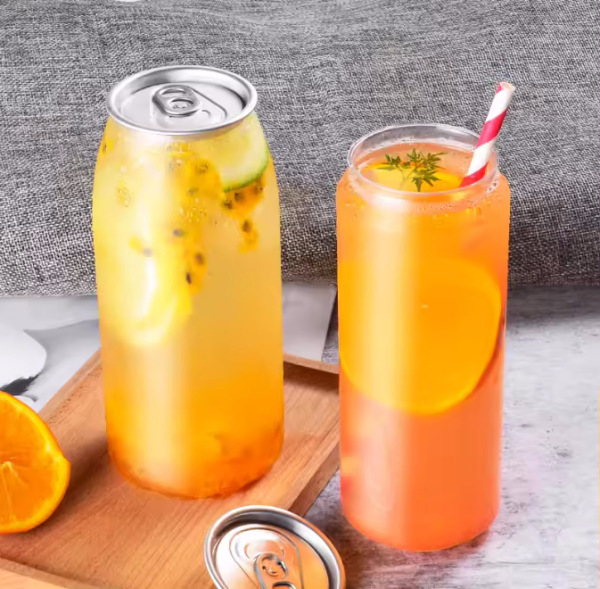
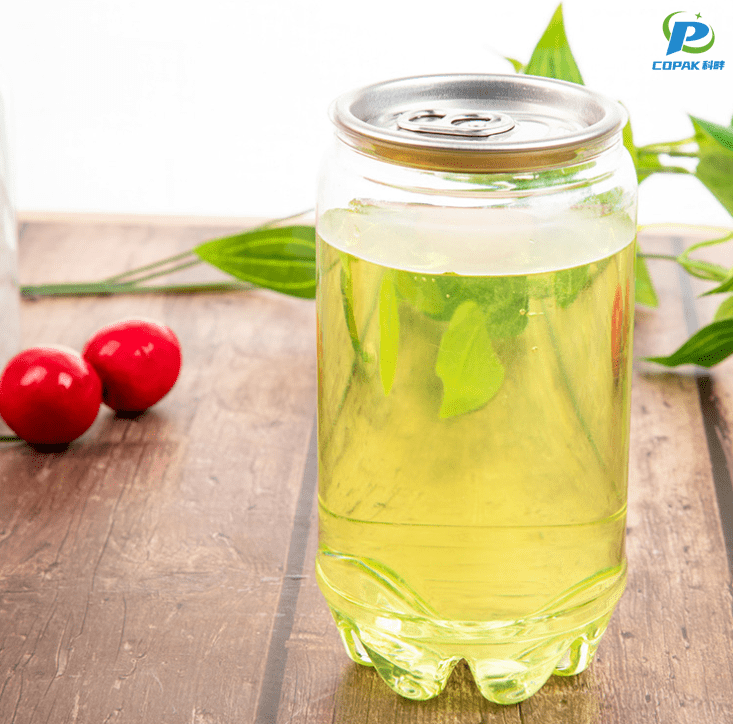
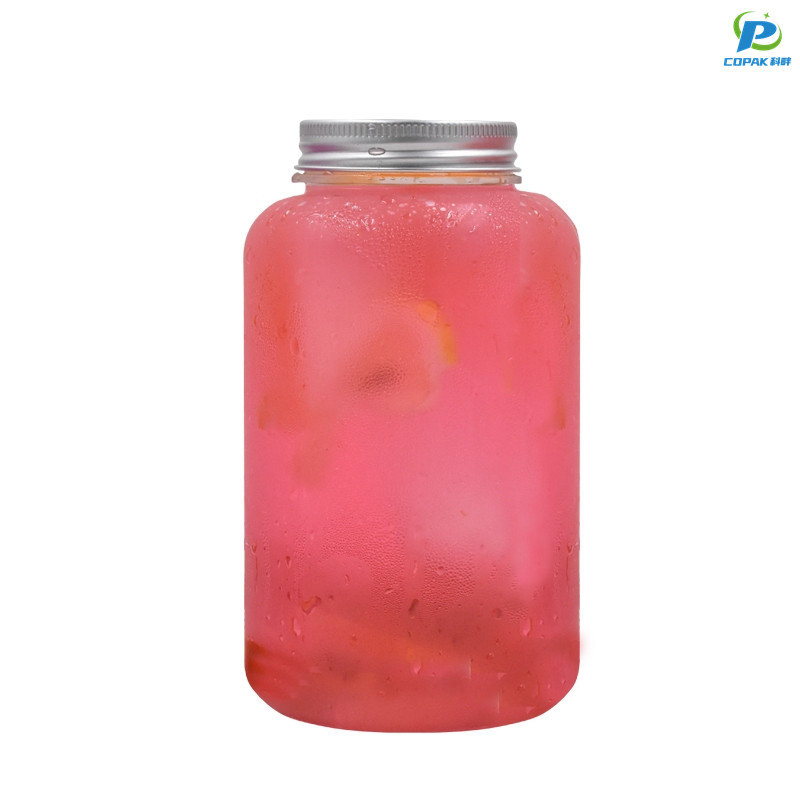
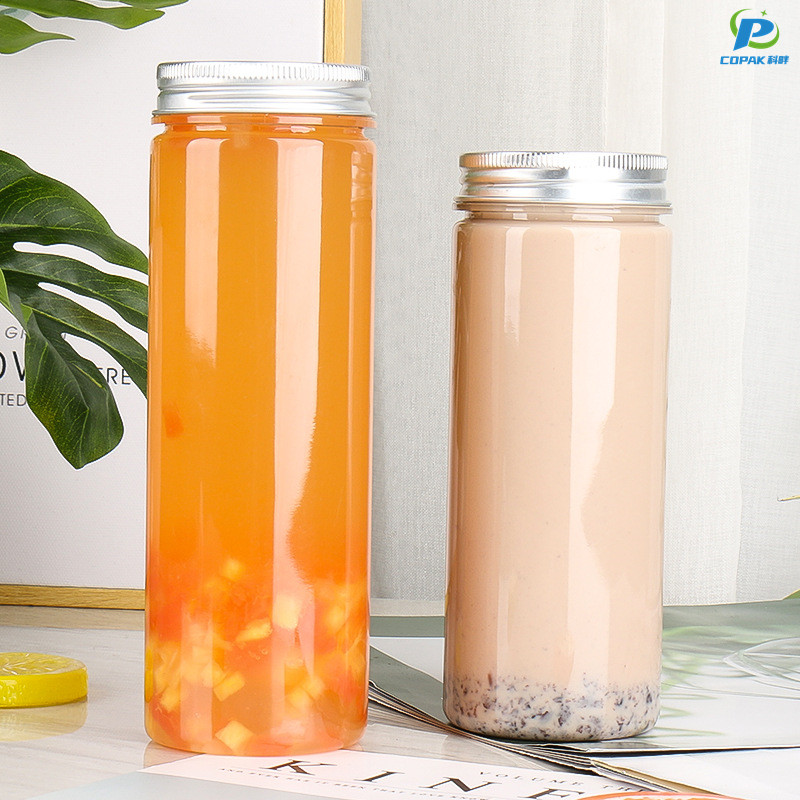
I'm a China-based manufacturer and supplier, here to meet your bulk packaging needs. The 500ml Plastic Bottle is designed for durability and easy handling, made from high-quality PET with a strong neck finish and secure cap. It suits cosmetics, beverages and household chemicals. I offer clear and tinted options, different neck finishes, and tamper-evident features for safety. For B2B purchasers, I provide flexible MOQs, competitive pricing and scalable production with fast lead times. Custom printing and labeling can be arranged to show your brand. I stand by strict quality control, leak tests, and stable supply to support your China market and international shipments. Partner with me for reliable packaging solutions from a trusted Manufacturer, delivering consistent quality and service that grows your business.
The 500ml plastic bottle is no longer just a commodity—it's the focal point of strategic partnerships that drive product success. Buyers worldwide are choosing bottles that combine lightweight cost-efficiency, excellent shelf appeal, and versatile compatibility with water, beverages, sauces and personal care products. Options like rPET/PCR content, recyclable formats, tamper-evident caps, barrier treatments and custom shape/labeling let brands meet sustainability goals and stand out on crowded shelves without sacrificing performance or compliance. Forward-looking suppliers act as partners offering end-to-end support: rapid prototyping, flexible minimums, consistent QC, certifications for global markets, and reliable logistics to reduce lead-time risk. That collaborative approach helps procurement teams optimize cost, speed-to-market and brand integrity—turning a simple 500ml bottle into a competitive advantage.
| Attribute | Typical Value | Notes |
|---|---|---|
| Nominal Volume | 500 mL | Standard single-serve beverage capacity |
| Material | PET (Polyethylene Terephthalate) | Widely used for clear beverage containers; high clarity and barrier for CO2-sensitive drinks |
| Resin Identification Code | 1 | Recycling stream code for PET; accepted in most municipal programs |
| Typical Empty Weight | 12 g (lightweight variant) | Common lightweight bottle weight; regional variants 10–25 g depending on design |
| Wall Thickness (average) | 0.20 – 0.40 mm | Averaged across body panels; thin-wall designs reduce material and emissions |
| Neck Finish | 28 mm (standard screw finish) | Common finish for beverage caps; alternate finishes include 24 mm and sport closures |
| Typical Height × Diameter | 205 – 225 mm × 60 – 70 mm | Design-dependent; taller slender styles optimize shelf presentation |
| Cap / Closure Type | Screw cap (PP) or tamper-evident screw cap | Polypropylene caps are typical; closures may affect recycling if not separated |
| Manufacturing Process | Injection Stretch Blow Molding (ISBM) | ISBM provides orientation for strength and clarity; standard for high-volume production |
| Cycle Time per Cavity | 2.5 – 6.0 seconds | Depends on machine size, mold design and cooling; multi-cavity molds reduce per-part time |
| Typical Line Compatibility | 20,000 – 48,000 bottles per hour | Ranges from medium to high-speed filler/packer lines; palletizing and labeling capacity varies |
| Labeling Area (approx.) | 150 × 90 mm | Shrink-sleeve, pressure-sensitive and wrap labels commonly used; area for artwork and nutrition panel |
| Recyclability | Widely recyclable | Acceptance depends on local programs and cap separation practices |
| Post-consumer PET Collection (global average) | ~30% (varies by region) | Higher in some regions (50%+) and lower in others; improvement trends ongoing |
| Estimated Carbon Footprint (cradle-to-gate, empty bottle) | ≈ 35 g CO2e / bottle | Typical value for a 12 g PET bottle produced from virgin resin; varies with energy mix and recycled content |
| Estimated Water Footprint (resin production) | ≈ 1.2 L / bottle | Includes water used in feedstock and processing stages; regional variation applies |
| Common Color Options | Transparent (clear), light-tinted (green/blue) | Clear maximizes recyclability; colored bottles may reduce recycling value |
| Common Applications | Still water, flavored water, RTD beverages | Also used for some dairy-style drinks where PET is suitable |
| Food Contact Regulatory Compliance | EU food-contact plastics regulation; US FDA 21 CFR guidelines (as applicable) | Design must meet migration and additive limits; verification via declarations and testing |
| Typical Drop Test Survival | 1.2 – 1.6 m (filled, standard handling) | Depends on fill pressure, cap torque and bottle geometry; engineered to survive distribution handling |
| Temperature Resistance | Short-term up to ~60°C; long-term service ≤40°C | Not suitable for sustained hot-fill unless specially formulated or heat-stabilized |
| Recycled Content (common practice) | 0 – 30% rPET in typical commercial runs | Higher rPET usage growing; mechanical recycling quality and regulatory limits influence percentage |
| End-of-life Options | Mechanical recycling, chemical recycling, energy recovery | Priority: increase collection and mechanical recycling to close loop |
| Design Considerations for Lightweighting | Neck-to-base optimization, panel shaping, wall-thinning | Targets to reduce material without compromising drop and stacking performance |
| Typical Shelf Life for Contents | 6–18 months (varies by beverage) | Shelf life determined by contents, oxygen barrier performance and storage conditions |
| Notes / Sustainability Actions | Use of rPET, improved collection, label and cap design optimization | Actions that increase circularity and lower lifecycle impacts without disclosing suppliers |