PET Bottles

Bulk Plastic Cups With Lids - China Manufacturer

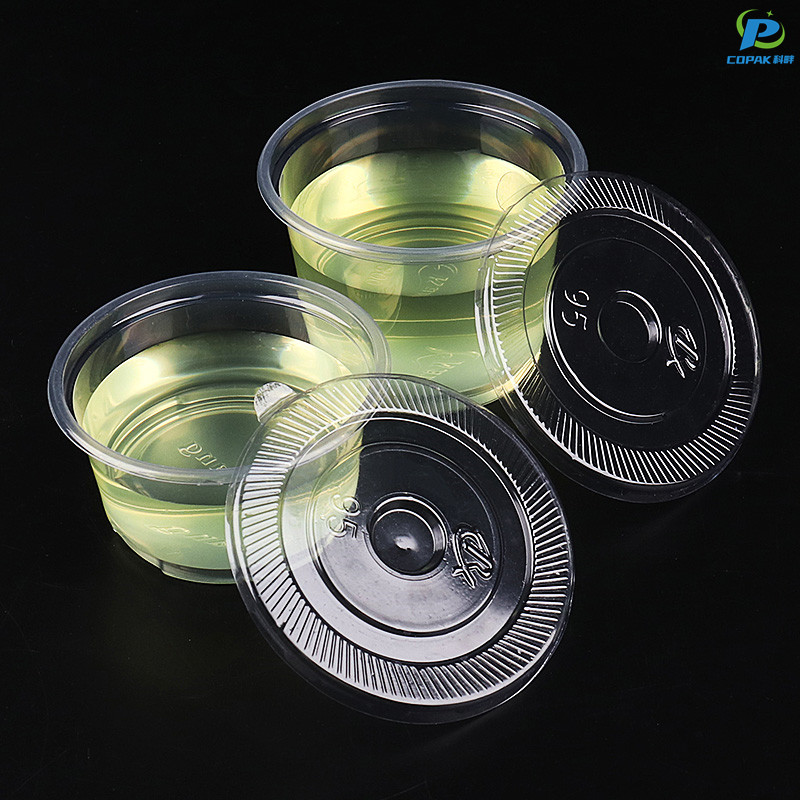
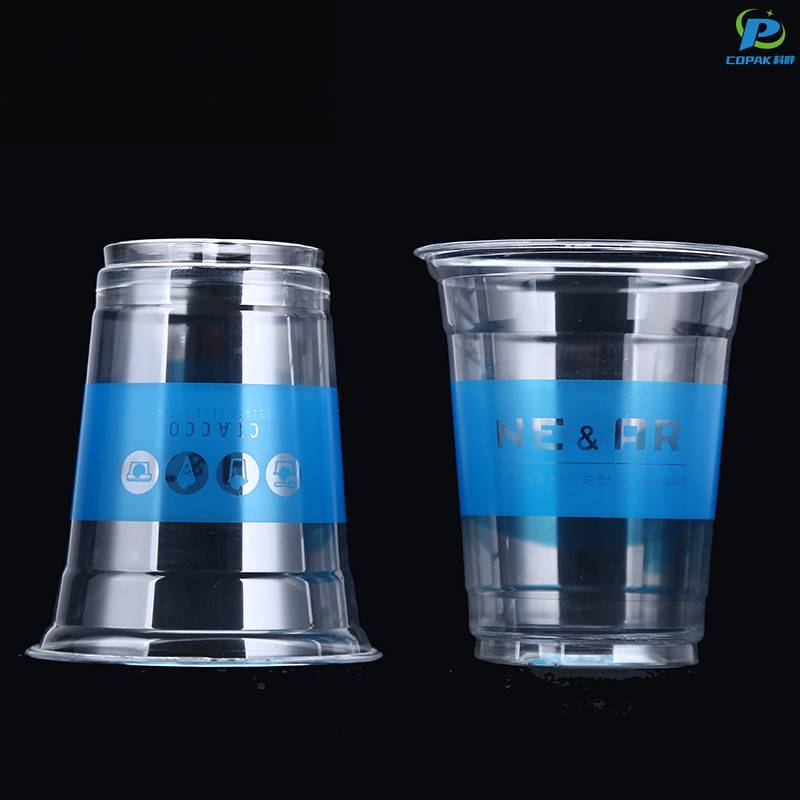
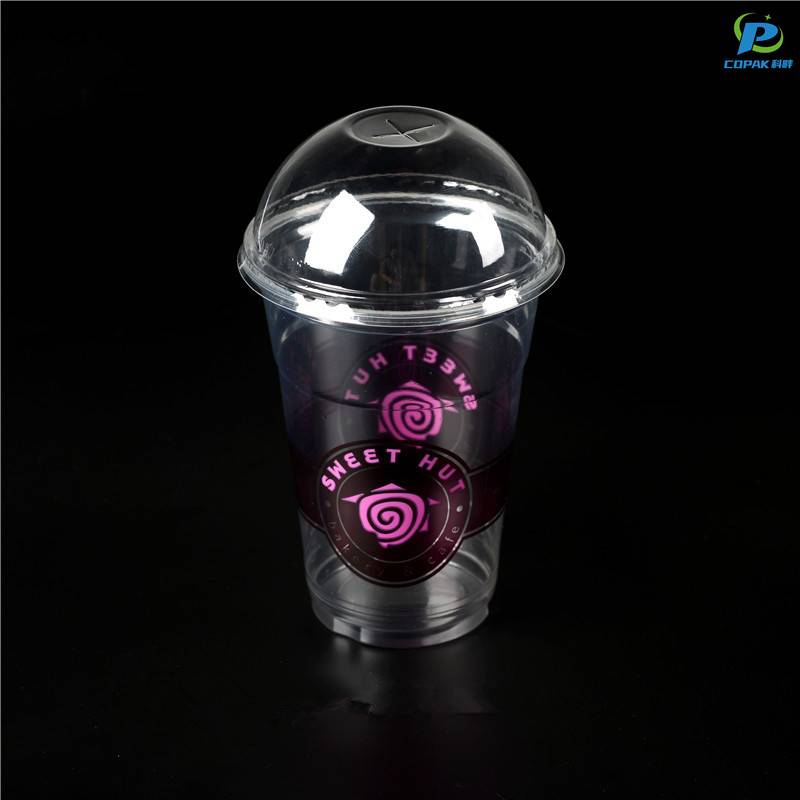
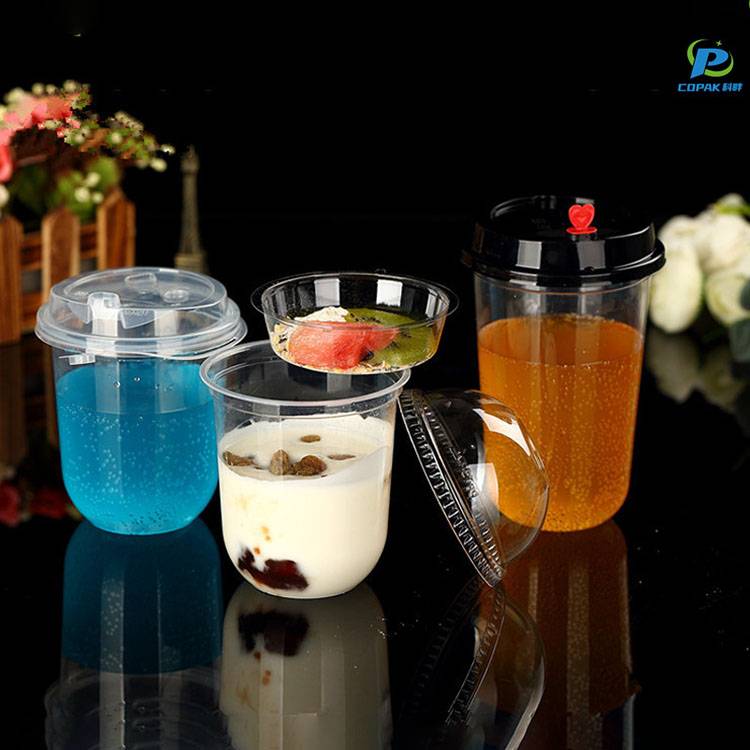
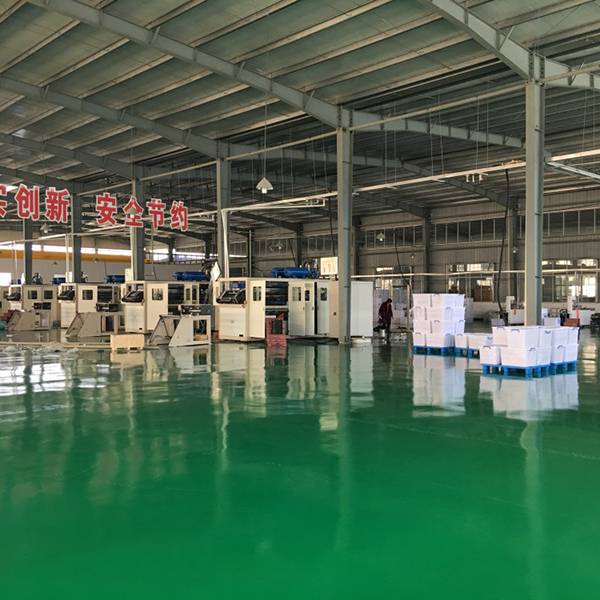
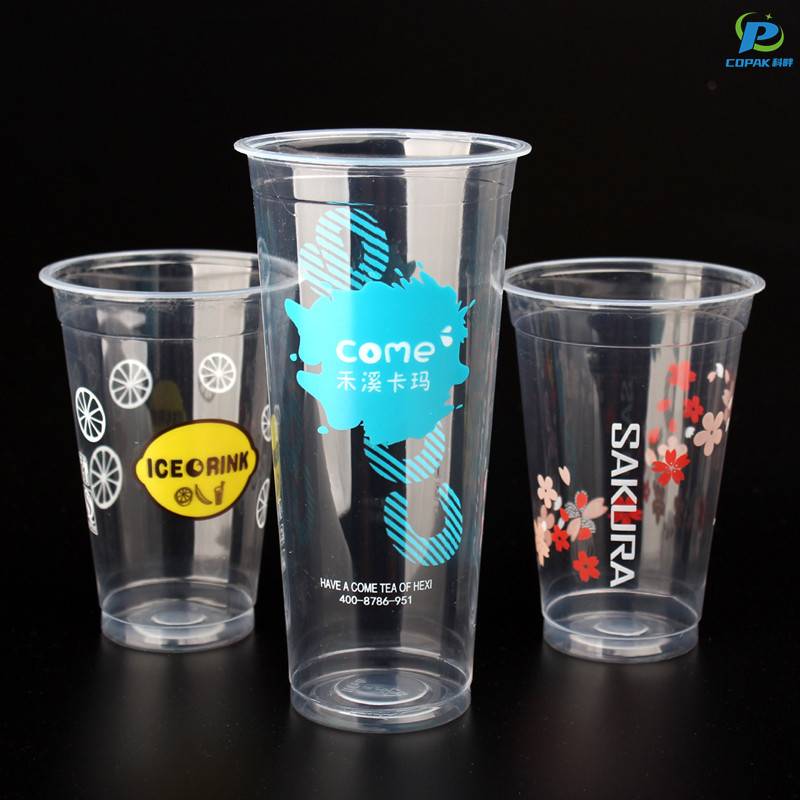
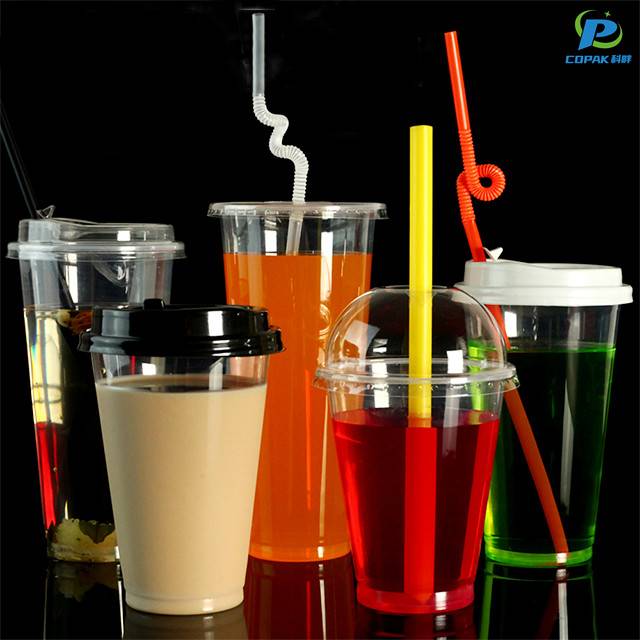
We are a China-based Manufacturer offering Bulk Plastic Cups With Lids in bulk quantities. Our approach keeps costs down for cafes, distributors, and food-service chains. These cups feature clear, crack-resistant PET or Tritan options, secure lids, leak-proof seals, and a stackable design. We offer laser-printed branding, custom lid colors, and flexible packaging options. We maintain strict quality control and ISO standards, with quick turnaround times and reliable shipping. As a direct-from-factory supplier, you save on middlemen and can scale orders up to thousands of cases. We welcome OEM/ODM requests and can tailor sizes, volumes, and lid types to your specs. If you’re buying Bulk Plastic Cups With Lids in China or shipping worldwide, we’ll coordinate from inquiry to delivery, ensuring on-time performance and competitive pricing.

Hot Selling Product

Bulk Plastic Cups With Lids Is The Best Guarantees Peak Performance

Choosing bulk plastic cups with lids is a smart move for buyers who prioritize peak performance across operations, cost and customer satisfaction. High-quality cups and snug, leak-resistant lids ensure spill-free transport, stackability saves storage space, and uniform dimensions streamline automated filling and sealing lines. Opting for food-grade, BPA-free materials with relevant safety certifications supports regulatory compliance and reduces product risk while offering recyclable or lightweight options to lower shipping costs and environmental impact. For global procurement teams, the value lies in reliable lead times, consistent quality control, and scalable production that adapts to seasonal demand. Customization options—colors, sizes, tamper-evident or snap-fit lids, and private-label printing—help differentiate offerings without compromising throughput. When suppliers combine rigorous inspection protocols, transparent pricing and flexible MOQ, bulk plastic cups with lids become not just a product, but a performance guarantee for supply chain efficiency and end-customer satisfaction.

{ Bulk Plastic Cups With Lids Is The Best Guarantees Peak Performance}
Product Type Material Lid Type Capacity (ml) Rim Ø (mm) Wall Thickness (mm) Temp Range (°C) Recyclability Microwave Safe Compostable Typical Use Cases Durability / Leak Resistance
Clear PET Cup (single-wall) PET (Polyethylene Terephthalate) Flat snap-on lid / Straw slot 250 / 355 / 473 70 / 90 / 98 0.18 – 0.30 -10 to 60 Widely recyclable (code 1) No No Cold drinks, iced coffee, fountain beverages Durability: 3/5 · Leak: 3/5
PETG Cup (thicker, clearer) PETG (Glycol-modified PET) Dome lid (straw aperture) 355 / 590 90 / 110 0.28 – 0.45 -10 to 70 Recyclable in PET streams (local rules vary) No (generally) No Premium cold beverages, smoothies, display cups Durability: 4/5 · Leak: 3/5
PP Cup (hot & cold) PP (Polypropylene) Sip lid / Press-fit lid 200 / 300 / 400 70 / 80 / 90 0.25 – 0.45 -20 to 120 Recyclable (code 5) where facilities exist Yes (short durations) No Coffee, hot beverages, takeaway drinks Durability: 4/5 · Leak: 4/5
HDPE Rigid Cup HDPE (High-Density Polyethylene) Snap-on lid / Sealed press-fit 300 / 450 78 / 95 0.35 – 0.60 -20 to 80 Widely recyclable (code 2) Limited (depends on design) No Industrial, catering, reusable cup programs Durability: 5/5 · Leak: 4/5
PLA (compostable) Cup PLA (Polylactic Acid) Flat lid / Compostable dome 250 / 350 / 500 75 / 95 / 100 0.20 – 0.35 -5 to 50 (deforms above ~60) Industrial composting available (varies locally) No (not recommended) Yes (commercial composting) Cold drinks, environmentally marketed events Durability: 2/5 · Leak: 3/5
PP Double-wall (insulated) PP (multi-wall construction) Sealable sip lid / Snap-lock 350 / 500 85 / 100 0.30 – 0.60 (combined walls) -20 to 110 Recyclable where PP accepted Yes (high-temperature resistant) No Hot and cold beverages where insulation is needed Durability: 5/5 · Leak: 5/5
Notes: Values shown are representative typical specifications for common cup and lid types. Local recycling and composting acceptance vary by municipality and facility; temperature behavior depends on exact resin grade and wall design.

Related Products

Eco Friendly Products

Bulk Plastic Cups With Lids Market Leader From Concept to Delivery

Lifecycle Stage Distribution for Bulk Plastic Cups (Volume and Cost %)

This chart visualizes the relative distribution of volume and cost contributions across seven stages in the lifecycle of bulk plastic cups with lids. The primary dataset represents percentage share of total production effort measured by volume throughput: Concept (5%), Design & Prototyping (8%), Material Sourcing (22%), Manufacturing (38%), Quality Control (7%), Packaging & Lids Assembly (12%), Delivery & Logistics (8%). A secondary dataset (stacked but displayed as adjacent bars) shows approximate cost allocation percentages for the same stages: Concept (2%), Design & Prototyping (4%), Material Sourcing (35%), Manufacturing (40%), Quality Control (3%), Packaging & Lids Assembly (8%), Delivery & Logistics (8%). The goal of presenting both series is to highlight where production volume and expenditure diverge: material sourcing and manufacturing together dominate both throughput and costs but often consume a larger share of expense than of volume, indicating high unit costs for raw materials and energy-intensive processes. Packaging and lids assembly attract a higher proportional share of operational effort relative to its cost, reflecting labor- or time-sensitive assembly steps. Quality control and logistical stages show modest shares, yet small percentage shifts here can meaningfully affect yield, return rates, and customer satisfaction. Product teams can use this visualization to prioritize investments: for example, negotiating material costs, optimizing molding and cycle times during manufacturing, or automating assembly to reduce labor overhead. Additionally, lifecycle thinking suggests that changes in material selection (lighter polymers, recycled content) will reconfigure both volume and cost shares. Decision makers should combine this chart with time-series data and unit cost breakdowns to track improvements and validate the impact of interventions on throughput, margin, and sustainability metrics. Regular monitoring of these indicators alongside supplier scorecards and energy consumption metrics enables targeted reductions in waste, improved forecasting accuracy, and stronger negotiation positions that can increase margins and reduce environmental footprint overall resilience.

Top Selling Products

Subscribe To Our Newsletter

For inquiries about our products or pricelist, please leave your email to us and we will be in touch within 24 hours.

Follow Us

on our social media
  • whatsapp (1)
  • instagram
  • youtube