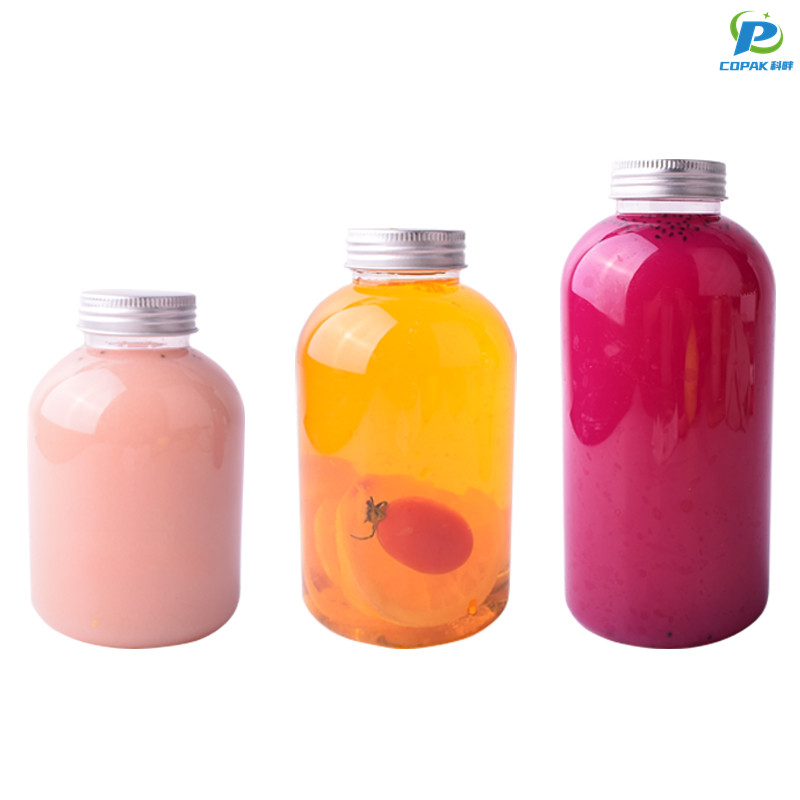
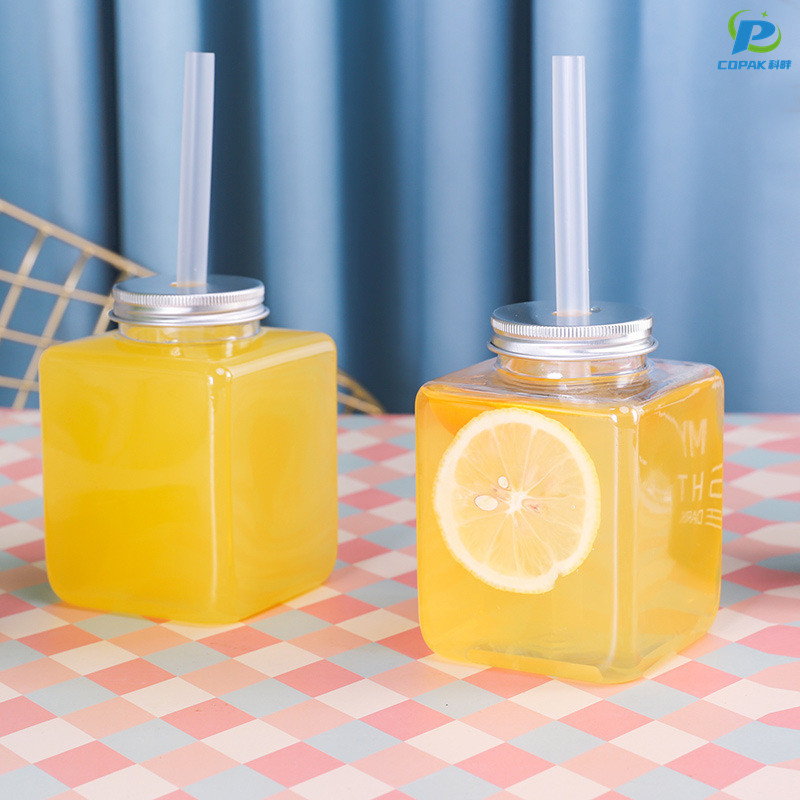
PET Bottles

Clear Plastic Drinking Cups - China Manufacturer for Quality Solutions

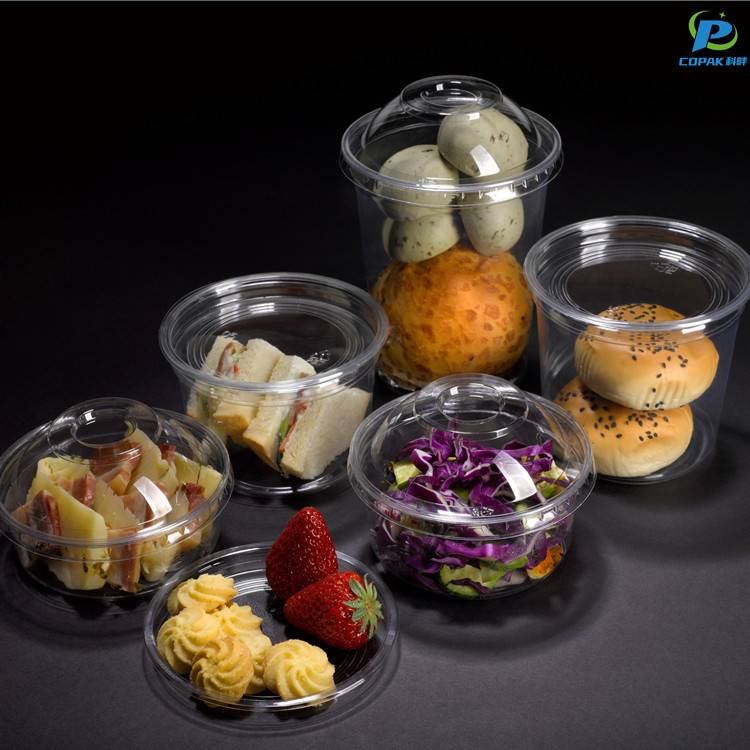
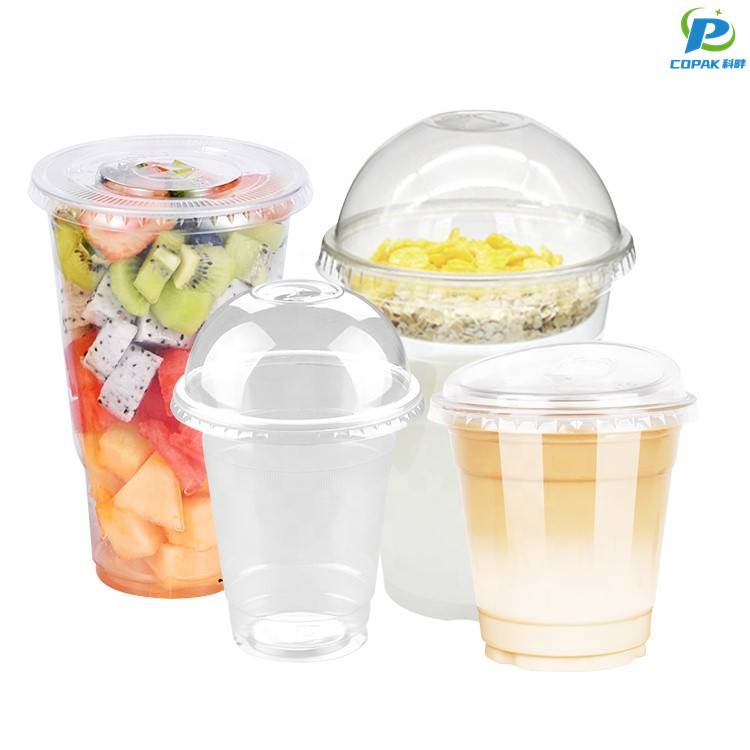
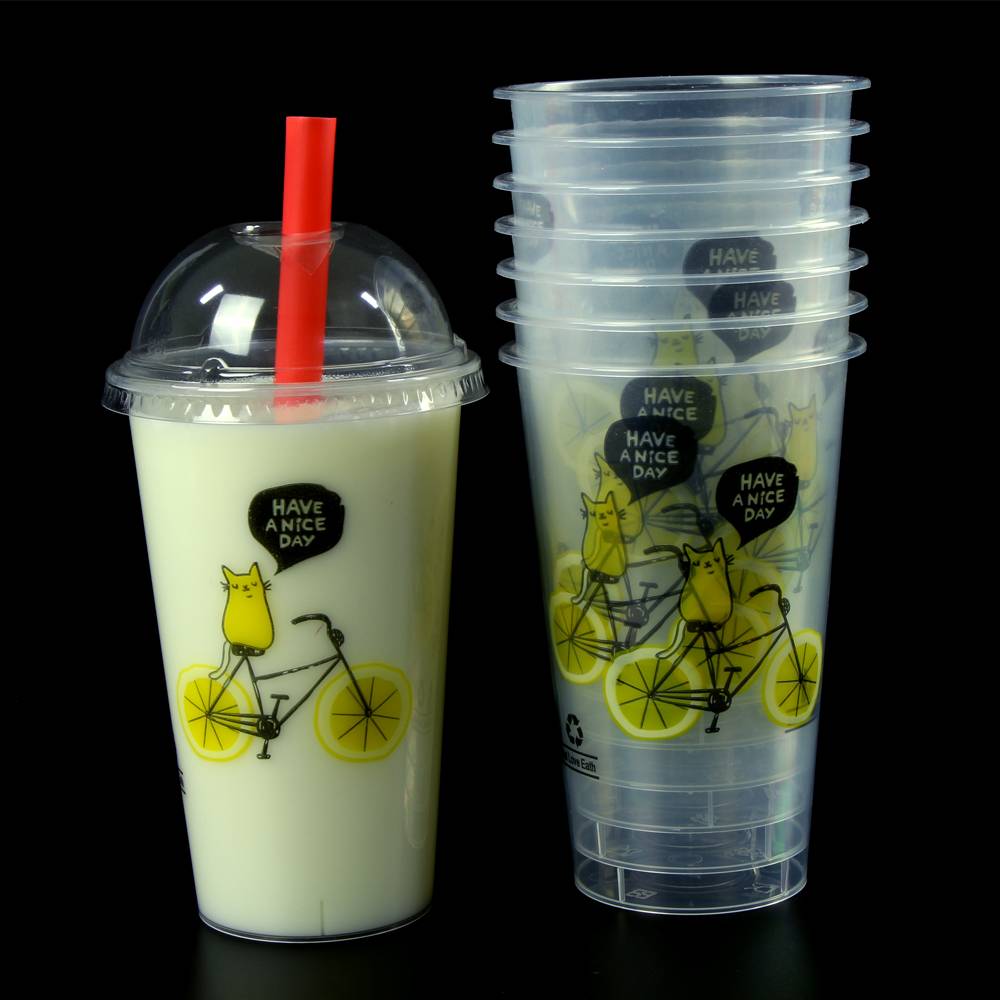
I’m a China-based manufacturer, delivering Clear Plastic Drinking Cups directly to distributors, caterers, and wholesalers. I know B2B buyers crave reliability, fast lead times and cost-efficiency, so my cups come in clear, food-grade material, BPA-free, and designed to be crystal-clear and leak-resistant. They’re stackable for easy storage and compatible with cold beverages, iced tea, juice, and soda; some variants handle hot drinks too. We offer multiple sizes and finishes, plus customization options for branding, logos, and packaging to suit your market. By cutting out middlemen, I can give you competitive pricing and steady supply with consistent thickness and quality control. If you’re seeking a trusted China Manufacturer, let’s discuss your required quantities, lead times, and packaging. I’ll tailor a solution that meets your demand and helps your business grow.

Hot Selling Product

Clear Plastic Drinking Cups Winning in 2025 Supplies the World\u2019s Top Brands

Clear plastic drinking cups are taking the lead in 2025, chosen by the world’s top beverage and hospitality brands for their unmatched clarity, strength and cost-effectiveness. Modern materials (high-clarity PET, recyclable PP and compostable PLA) deliver glossy transparency, reliable food-safety compliance and excellent stackability, while advanced tooling permits full custom printing, embossed logos and tight tolerances for lids and seals—ensuring products look premium on shelf and perform under high-demand service conditions. For global buyers seeking dependable partners, Shanghai-based manufacturing capabilities now offer high-volume capacity, stable lead times, competitive pricing and international certifications (ISO, FDA/EU/LFGB, third-party testing). Integrated quality control, flexible MOQs and sustainable options (PCR content, compostable blends, optimized packaging) make it easy to scale SKUs, meet retailer specs and shorten time-to-market—helping leading brands stay ahead in design, sustainability and cost.

{ Clear Plastic Drinking Cups Winning in 2025 Supplies the World’s Top Brands}
Metric Unit 2022 2025 (est) 2030 (proj) Notes
Global annual production billion units 70 85 100 Estimate includes single-use and lightweight reusable clear cups
Average weight per cup g (grams) 7.5 7.2 6.8 Lightweighting driven by design & material optimization
Total material used thousand metric tons 525 612 680 Calculated from volume × average weight
Primary polymer: clear PET share % by units 60% 65% 68% Clear PET favored for clarity and established recycling streams
Recyclability (collection & processing) for clear cups % 28% 35% 45% Improvements expected from separate collection and sorting tech
Compostable / bioplastic cup share % by units 6% 8% 10% Growth limited by cost, infrastructure and performance trade-offs
Market share by application — Cold beverages % by units 55% 57% 58% Includes soft drinks, iced coffee and bottled water cup use
Market share by application — QSRs & events % by units 25% 24% 23% Event consolidation and reusable programs may reduce single-use share
Retail multipacks & household use % by units 10% 9% 8% Shift to durable reusable options in some households
Growth CAGR (2022–2025) % 6.5% Projected by regional expansion and lightweighting adoption
Regional per capita consumption — Europe units / year 45 48 50 EU shows moderate per-capita use with rising reuse programs
Regional per capita — North America units / year 65 68 70 High baseline driven by QSR and beverage takeaway culture
Regional per capita — Asia‑Pacific units / year 30 40 50 Rapid growth expected as consumption patterns converge
Regional per capita — Latin America units / year 20 24 28 Growing middle-class and convenience consumption
Regional per capita — Africa units / year 5 7 10 Lower baseline but faster relative growth in urban areas
Average GHG footprint per cup g CO2e 38 34 30 Reduction from recycled content and lightweighting measures
Average recycled content (clear cups) % by mass 12% 18% 25% Driven by mandates and availability of food‑grade recycled PET (rPET)
Regulatory environment Moderate restrictions Strengthening EPR & recycled content mandates Evolving Extended Producer Responsibility Policy trend: more collection targets & rPET requirements
Data represents consolidated market estimates and commonly reported sustainability indicators (volumes rounded for clarity).

Related Products

Eco Friendly Products

Clear Plastic Drinking Cups Sets the Industry Standard More Than a Supplier - A Partner

Industry Adoption Index: Clear Plastic Cups — Partner-Led Growth vs Supplier-Based Sales (2016–2025)

This chart compares two adoption pathways for clear plastic drinking cups across a ten-year horizon: partner-led adoption versus traditional supplier-driven sales. The partner-driven series models outcomes when manufacturers, distributors, and service providers collaborate on product integration, sustainability programs, and co-marketing, while the supplier-driven series represents a more transactional relationship focused only on supply and distribution. Data points are illustrative but reflect a realistic dynamic where partnership strategies accelerate market penetration: partner-driven adoption begins modestly but then accelerates after 2019 as integrated service offerings, bulk procurement partnerships, and sustainability certifications lower barriers to adoption. Supplier-driven growth rises steadily but plateaus as competitive pressures and limited value-added services constrain further expansion. Key insights include (1) compounding benefits of partnership investments that produce increasing adoption rates over time, (2) diminishing returns for supplier-only approaches in later years, and (3) an expanding gap after 2020 that suggests strategic partnerships deliver higher long-term market share for clear plastic cup products. Practitioners can use this kind of analysis to prioritize channel development, measure the return on collaborative initiatives, and target interventions—such as joint sustainability campaigns or bundled logistics—to sustain accelerated growth. Limitations: the chart simplifies many variables (pricing, regulation, material innovation), so organizations should combine such trends with operational and market research before making major investments. Nonetheless, the graphic highlights how transforming supplier relationships into strategic partnerships can set a stronger industry standard and drive sustained adoption.

Top Selling Products

Subscribe To Our Newsletter

For inquiries about our products or pricelist, please leave your email to us and we will be in touch within 24 hours.

Follow Us

on our social media
  • whatsapp (1)
  • instagram
  • youtube