PET Bottles

Clear Juice Containers - China Manufacturer for Global Markets

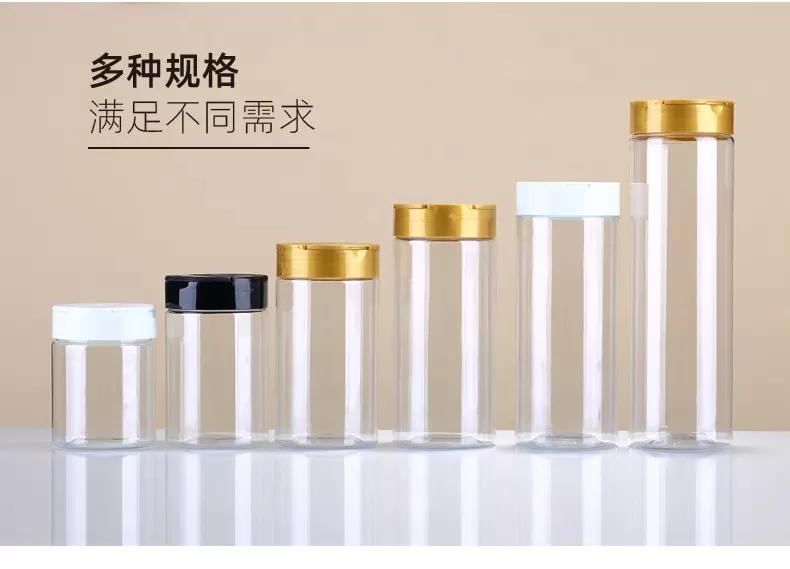
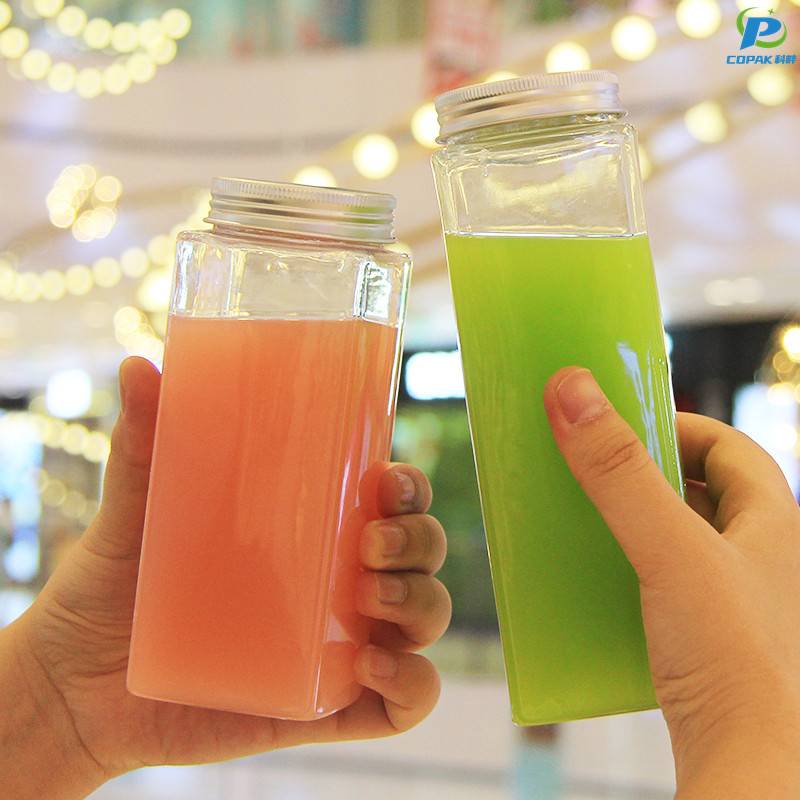
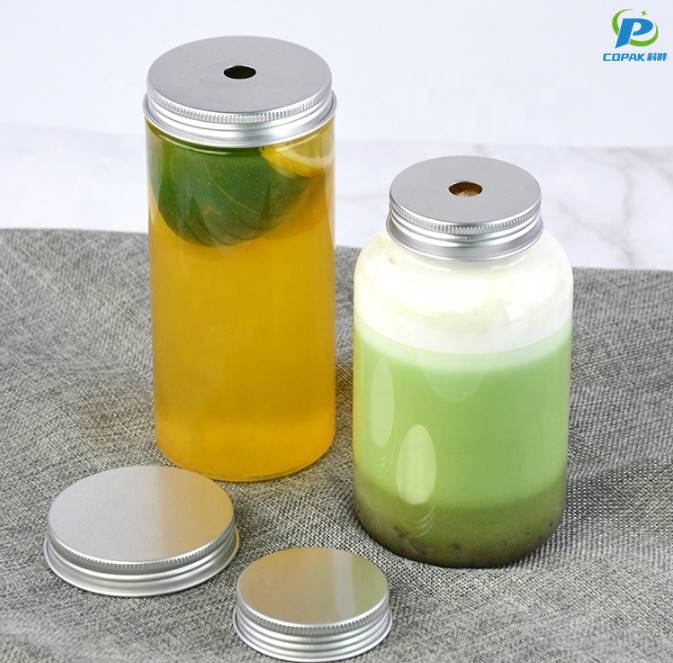
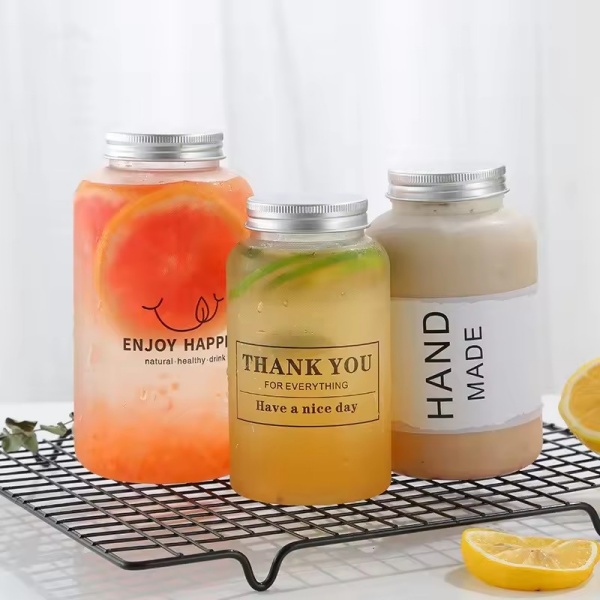
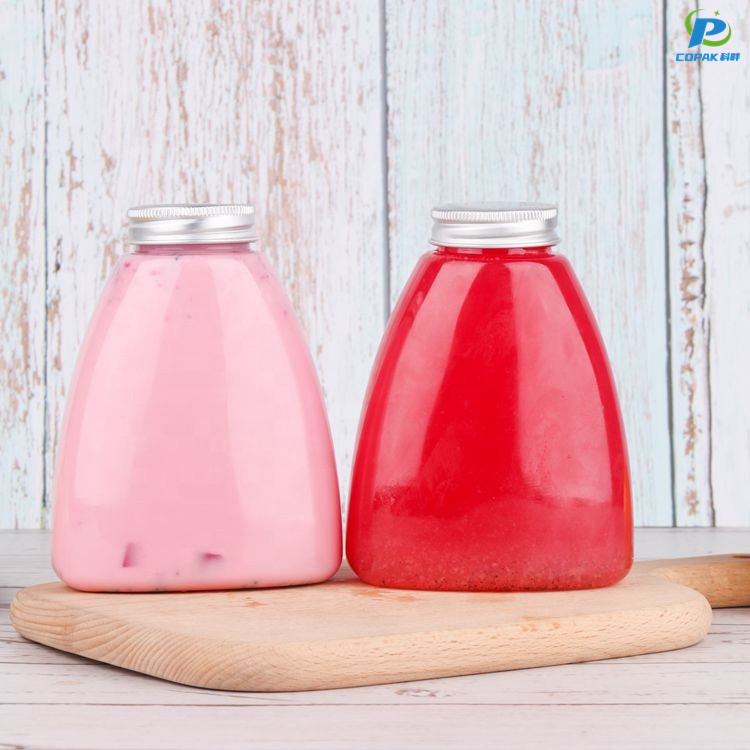
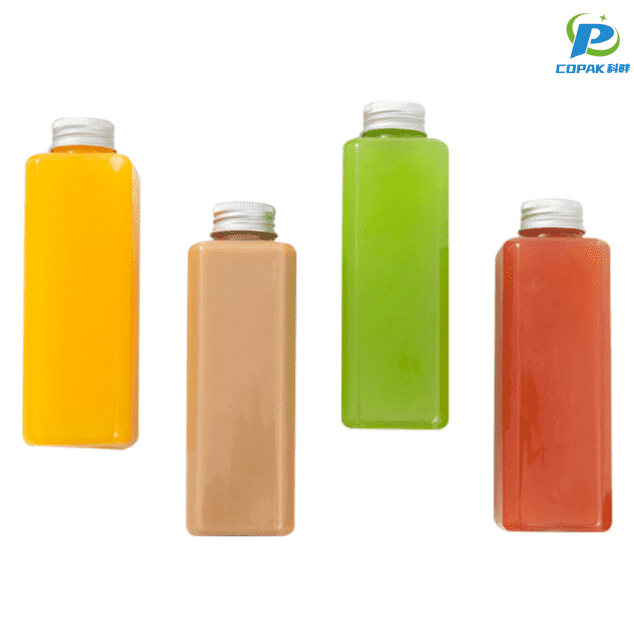
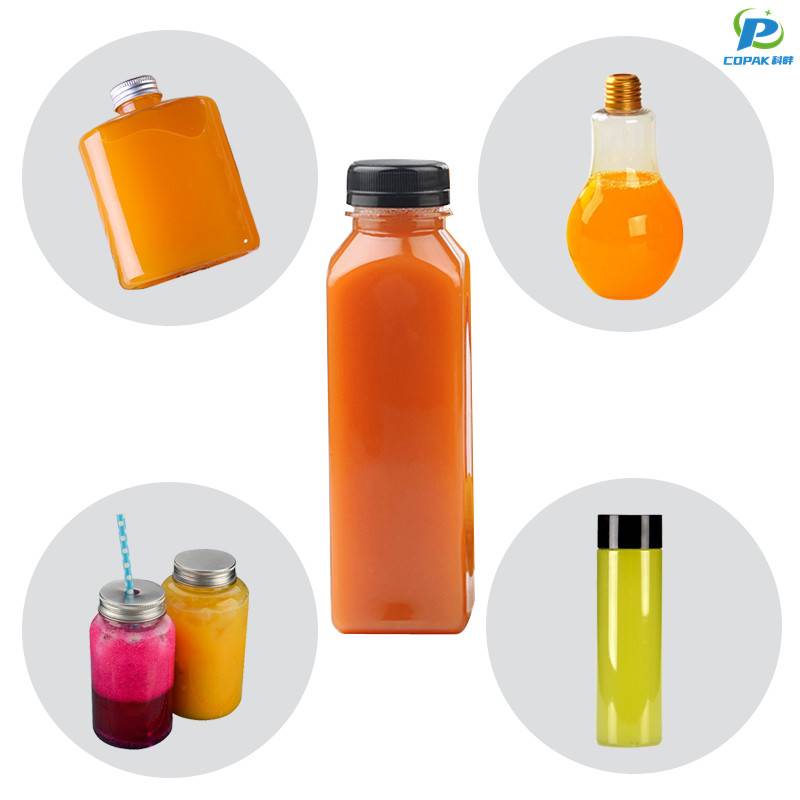
As a China-based manufacturer, I proudly offer Clear Juice Containers that meet the demands of beverage brands and bottlers. B2B buyers like you want reliability, safety, and cost efficiency, so I design packaging with food-grade materials, tight tolerances, and easy-to-seal closures. My Clear Juice Containers preserve color and aroma while resist cracking from cold fills or hot-fill processes. I customize sizes, cap colors, and volumes to fit your line, with competitive pricing and short lead times. Whether you source domestically in China or partner worldwide, you’ll get compliant packaging with HACCP/FDA standards, leak-proof performance, and stackable designs for efficient warehousing. I’m committed to being your steady Manufacturer partner, offering flexible MOQs, dependable shipping, and hands-on support from sample to scale. If you’re looking for dependable Clear Juice Containers to elevate your brand, I’m ready to help your project move forward smoothly.

Hot Selling Product

Clear Juice Containers Service Where Innovation Meets 2025

Clear Juice Containers Service: Where Innovation Meets 2025 As global demand for transparent, safe and sustainable juice packaging accelerates, our end-to-end clear juice container service blends cutting-edge materials science with responsive supply-chain solutions. We offer crystal-clear PET and compostable alternatives with advanced barrier coatings, anti-fog finishes, tamper-evident closures and smart-label integration (QR codes, freshness indicators) to meet retail, foodservice and private-label needs. All designs prioritize recyclability, lightweighting and reduced carbon footprint to align with 2025 sustainability targets. From rapid prototyping and tool-free customization to scalable mass production, quality control under international standards and streamlined global logistics, buyers gain predictable lead times, competitive pricing and regulatory compliance (FDA/EU/ISO). Collaborate on co-development, private-label launches or seasonal programs backed by technical support, material traceability and flexible MOQ options — delivering clarity, safety and market-ready innovation for juice brands worldwide.

{ Clear Juice Containers Service Where Innovation Meets 2025}
Model ID Material Typical Capacity (mL) Seal Type Recyclability Rate (%) Carbon Footprint (g CO2e/unit) Leak Rate (%) Transit Damage Rate (%) Shelf-life Extension (days) Compliance Standards Avg Lead Time (weeks) Market Adoption 2024 (%)
CJ-01 Clear PET 250 Screw cap (tamper-evident) 92 48 0.20 0.80 3 FDA, EU food contact 6 28
CJ-02 rPET (high-clear) 330 Screw cap 95 35 0.15 0.60 5 FDA, EU food contact 8 22
CJ-03 Clear Glass 250 Twist-off cap 70 350 0.00 2.50 90 FDA, EU food contact 10 15
CJ-04 PLA (clear, compostable) 300 Press-fit lid 18 40 0.60 1.20 2 ASTM D6400, EN 13432 7 5
CJ-05 Barrier PET (clear) 250 Induction seal + screw 88 55 0.10 0.90 30 FDA, EU, ISO 22000 9 18
CJ-06 High-clarity Acrylic (PMMA) 300 Snap lid 40 120 0.40 1.50 14 FDA, EU 12 3
CJ-07 Lightweighting PET (thin-wall) 250 Screw cap 90 30 0.25 1.10 1 FDA, EU 5 9
Note: All values are representative operational averages for clear juice packaging options in current industry practice (2024–2025).

Related Products

Eco Friendly Products

Clear Juice Containers Service Service Backed by Expertise

Clear Container Collection Efficiency by Container Type

This chart, titled "Clear Container Collection Efficiency by Container Type", illustrates the percentage return rate observed for six transparent container categories commonly used in beverage services. Return rate is defined as the share of distributed containers that are collected and returned for reuse or appropriate recycling within a standard collection period. Higher percentages indicate more effective recovery and greater potential for reuse, lowering environmental impact and improving operational economics. The hypothetical dataset reflects plausible operational outcomes: reusable plastic containers typically show the highest return rate (90%), supported by dedicated deposit schemes, durable design, and strong consumer familiarity. Small glass containers register high recovery as well (85%) because of established local return networks and the value retained in glass reuse. Large glass containers are somewhat lower (78%) due to heavier handling requirements and transportation constraints. PET bottles present a split by size, with small PET items at 72% and large PET items at 65%, suggesting that ease of handling, consumption patterns, and drop-off convenience influence participation. Bioplastic containers trail at 54%, reflecting nascent collection infrastructure and confusion in sorting streams. These distinctions point to practical implications: focusing infrastructure investments on underperforming categories—especially large PET and bioplastic—can yield measurable gains. Interventions include expanding dedicated collection points, enhancing route optimization for heavy volumes, and coupling logistics with consumer incentives like deposits or credits. Clear labeling and consumer education also improve capture rates. For operational planners and sustainability teams, the visualization offers a concise guide for prioritizing resource allocation: invest where the marginal return on collection effort is highest, while designing pilot programs to test scalable interventions for lower-performing container types. Over time, iterative monitoring and targeted policies can shift the distribution toward higher recovery and reuse. Regularly updating collection metrics ensures continuous improvement and supports evidence-based decision making across evolving service geographies globally.

Top Selling Products

Subscribe To Our Newsletter

For inquiries about our products or pricelist, please leave your email to us and we will be in touch within 24 hours.

Follow Us

on our social media
  • whatsapp (1)
  • instagram
  • youtube