




Crystal Clear Plastic Cups - China Manufacturer for Disposables
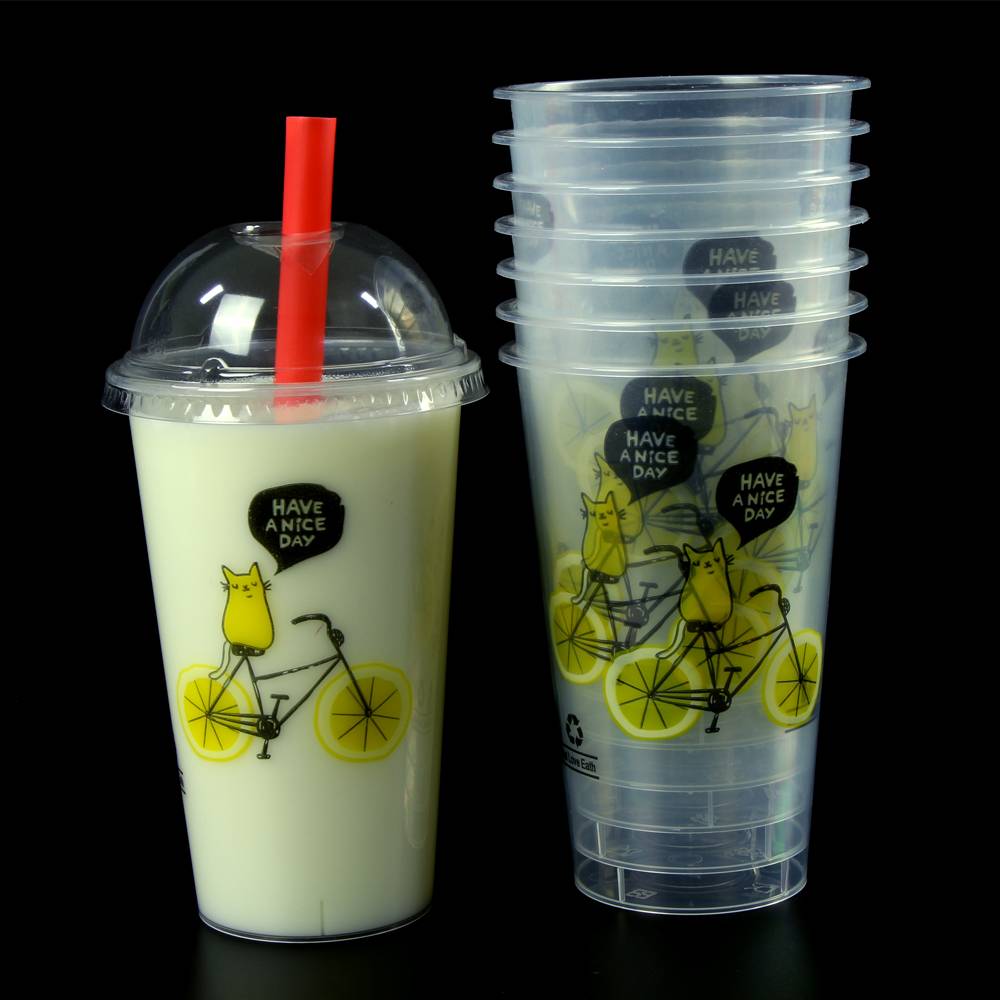
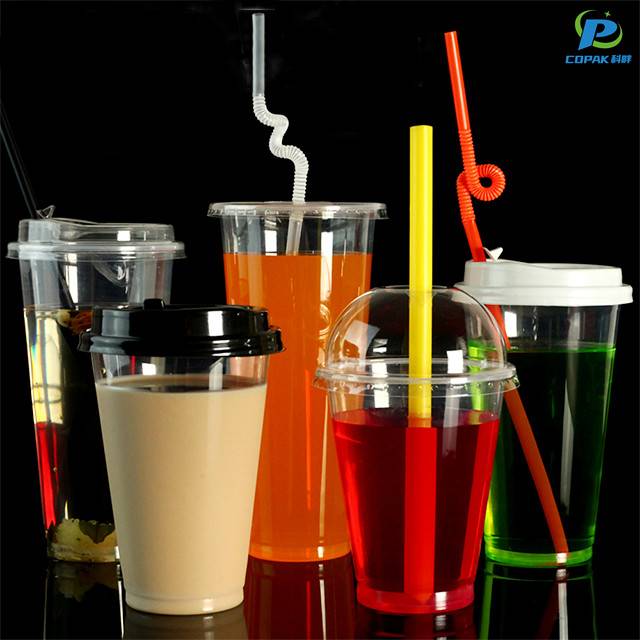
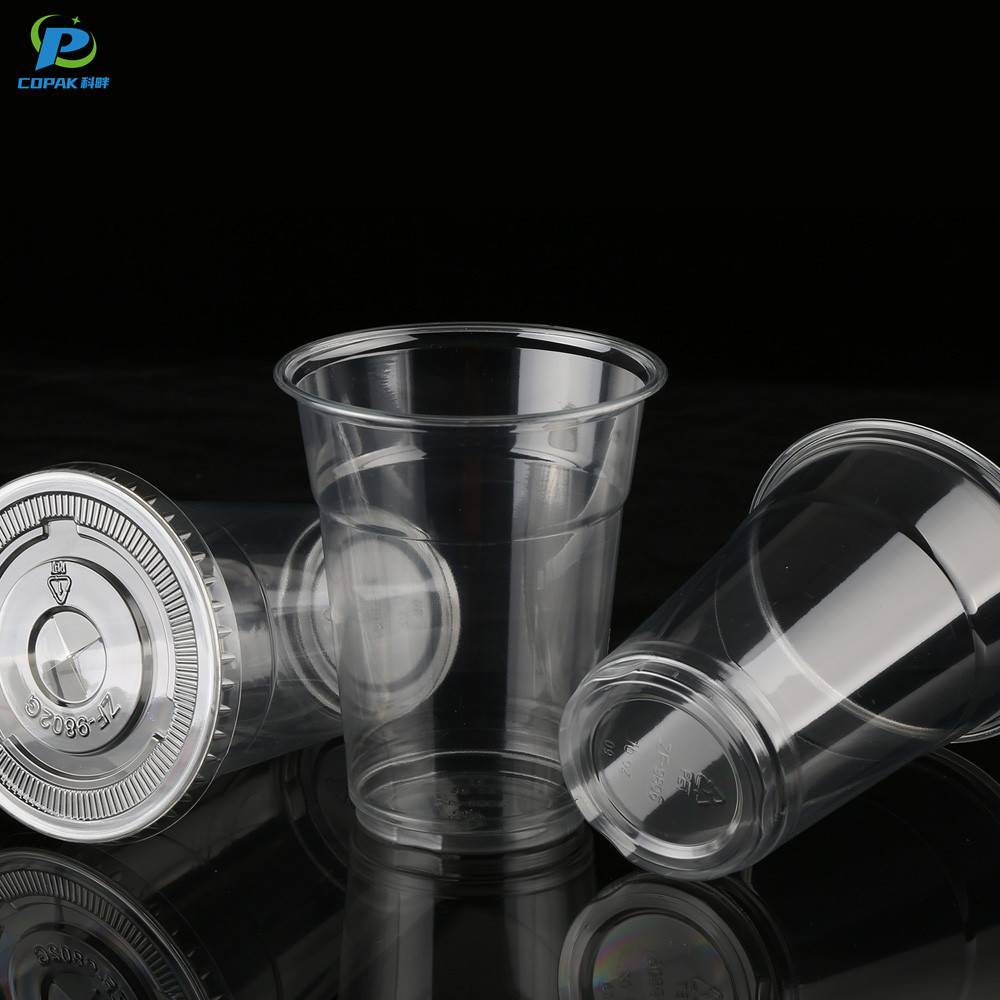
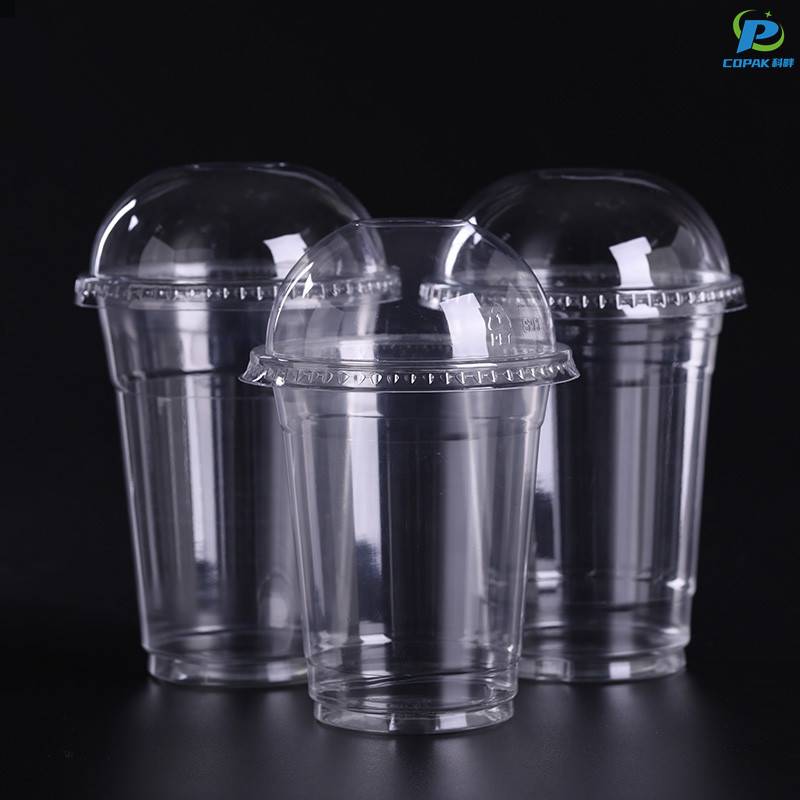
From my factory in China, I bring Crystal Clear Plastic Cups that meet the demands of busy catering, events, and retail buyers. I’m a China-based Manufacturer, focused on consistent quality and reliable supply. My cups stack neatly, are crystal clear, and are designed to resist cracking under normal use. They’re BPA-free, food-grade, and safe for hot or cold drinks, with airtight lids and smooth rims for easy sipping. For B2B buyers, I offer bulk pricing, flexible MOQs, and fast lead times, plus customization on embossing, labeling, or logo printing. I can ship worldwide from my warehouse network, with samples available to verify clarity and fit. If you need sustainable options, I can discuss recyclable materials and compliant packaging. Choose Crystal Clear Plastic Cups for a dependable cup that enhances your brand and minimizes waste—direct from a trusted China Manufacturer.



Crystal Clear Plastic Cups Leads the Global Market Supplies the World\u2019s Top Brands
Crystal-clear plastic cups have become the preferred choice for global brands seeking premium presentation, durability and food safety. Manufactured with food-grade, regulatory-compliant materials, these cups deliver optical clarity, consistent wall thickness, leak resistance and stackability across a wide range of sizes and capacities. Custom printing, embossing, color accents and tailored dimensions allow perfect brand alignment for beverage, catering and retail applications. Backed by robust production capacity, rigorous quality control and flexible order volumes, suppliers can meet seasonal spikes and long-term programs with predictable lead times and competitive pricing. Sustainable options such as PCR content and fully recyclable designs reduce environmental footprint without sacrificing performance. For procurement teams focused on quality, traceability and reliable logistics, crystal-clear cups offer a scalable, cost-effective solution ready for global deployment.
| Dimension | Metric | Value / Notes |
|---|---|---|
| Global production (annual) | 48.0 billion units | Estimated aggregate annual production of clear single‑use plastic cups (industry aggregate estimates). |
| Material composition — PET | 45% (21.6B units) | Average unit weight ~6 g → mass ~129,600 metric tons. Widely used for clear, rigid cups; higher mechanical recyclability vs. many alternatives. |
| Material composition — Polystyrene (PS) | 30% (14.4B units) | Average unit weight ~4 g → mass ~57,600 metric tons. Common for rigid, low‑cost clarity applications; recycling streams are limited in many regions. |
| Material composition — Polypropylene (PP) | 20% (9.6B units) | Average unit weight ~5 g → mass ~48,000 metric tons. Used for hot‑resistant clear/translucent cups and hinged designs. |
| Material composition — Other (PLA, blends, co‑polymers) | 5% (2.4B units) | Average unit weight ~7 g → mass ~16,800 metric tons. Includes compostable bioplastics and specialty blends; collection infrastructure varies widely. |
| Industry mass (derived) | ~252,000 metric tons/year | Sum of material mass estimates using unit counts and average weights by material class. |
| Recycling performance — PET | 30% | Recycled mass ~38,880 metric tons (based on PET mass and regional collection rates). PET cups face contamination/clarity sorting challenges compared with PET bottles. |
| Recycling performance — PS | 9% | Recycled mass ~5,184 metric tons. Mechanical recycling limited; material often downcycled or landfilled in many regions. |
| Recycling performance — PP | 10% | Recycled mass ~4,800 metric tons. Increasing uptake in selective streams but still low for many cup formats. |
| Recycled mass — all materials (estimated) | ~49,700 metric tons | Overall recovered share ≈ 19.7% of total estimated mass; highlights opportunity for improved collection and design‑for‑recycling. |
| Regional production share | Breakdown by region | Asia‑Pacific: 60% (28.8B units) • North America: 15% (7.2B) • Europe: 13% (6.24B) • Latin America: 7% (3.36B) • Middle East & Africa: 5% (2.4B). |
| Primary end‑use sectors (global) | Sector share | Foodservice / take‑away: 55% • Events & catering: 20% • Retail & vending: 15% • Household & other: 10%. |
| Key sustainability indicators | Summary | Average unit weight (weighted) ~5.25 g • Industry mass ≈252,000 t/year • Estimated recycled mass ≈49,700 t/year • Typical share designed for mechanical recycling ≈25%. |
| Top export destination shares (by volume) | Major destination shares | China 22% • United States 18% • Germany 6% • United Kingdom 5% • Japan 4% • Brazil 3% • United Arab Emirates 2%. |
| Design & circularity trends | Observed industry direction | Increasing adoption of mono‑material designs, lightweighting, recycled content targets and clearer labeling for recycling. Regional infrastructure remains the limiting factor for higher recycling rates. |
Related Products



Crystal Clear Plastic Cups Trusted by Pros From Concept to Delivery
Top Selling Products







- Related Blog
- Reviews
- Reviews
