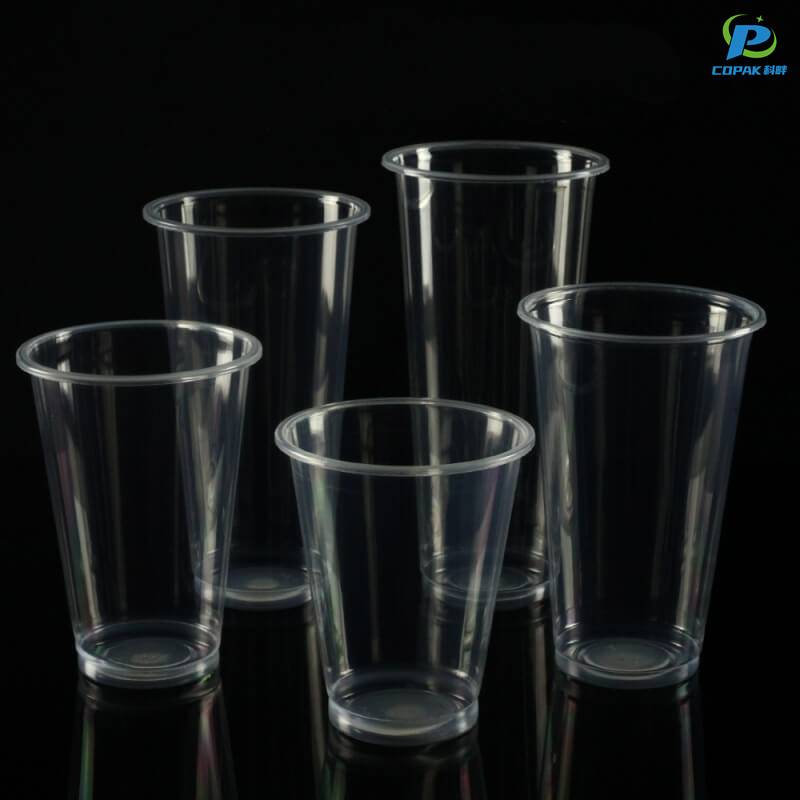
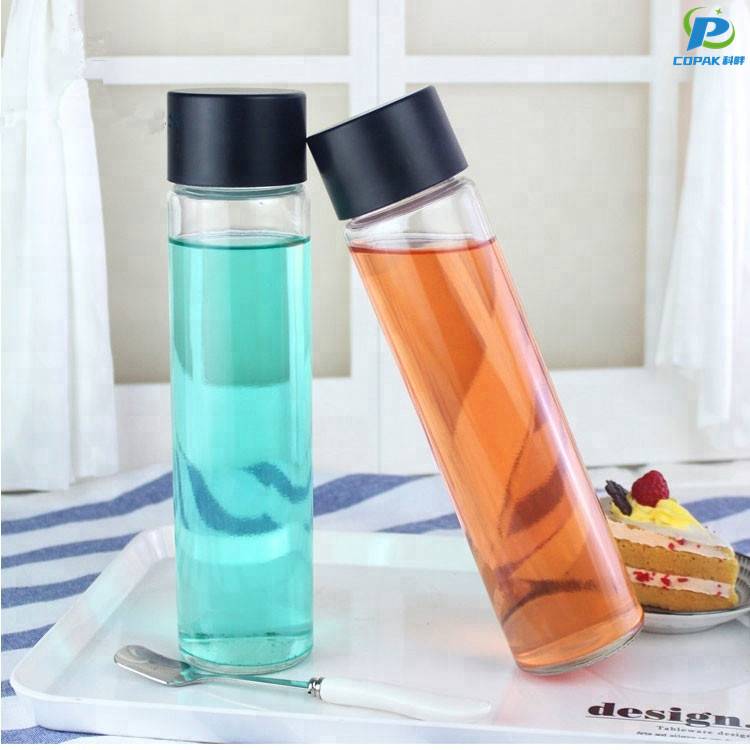
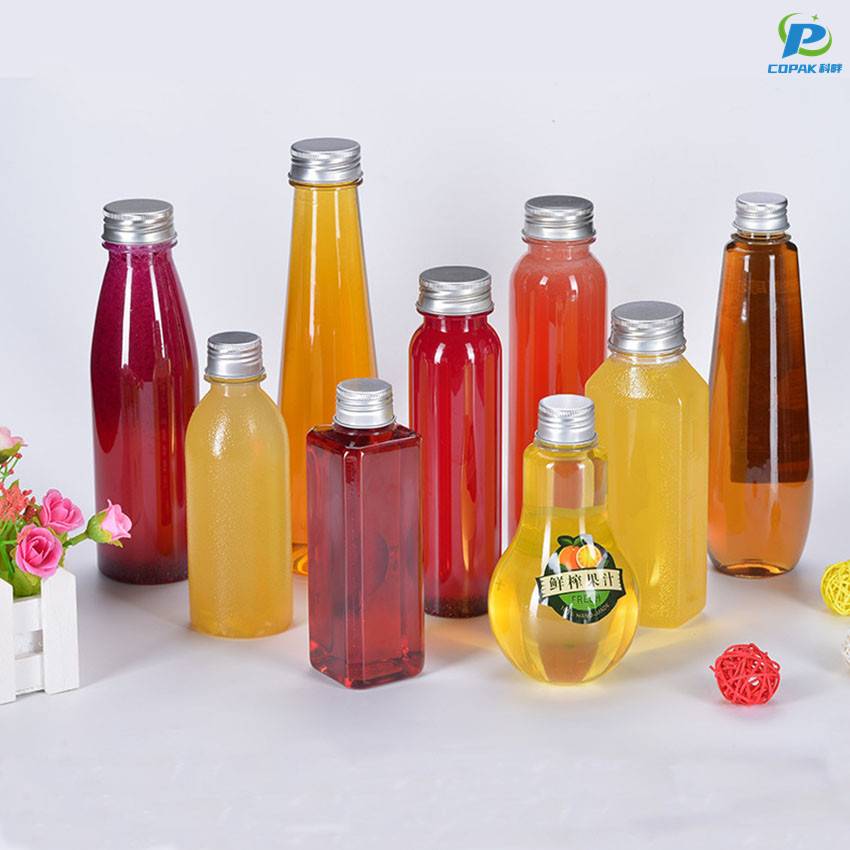
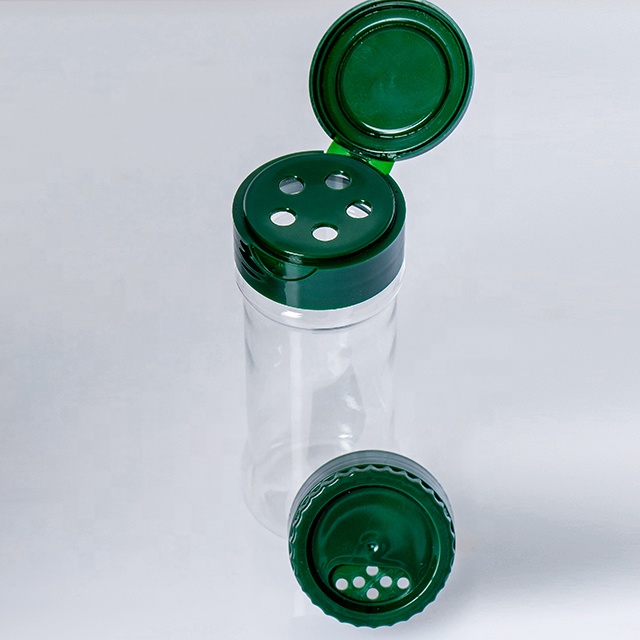
From my network of factories in China, I stand as your PET Bottle Supplier In China, ready to meet your packaging needs with efficiency and value. I work directly with trusted Manufacturer partners to offer a wide range of PET bottles, from slim 50ml sample jars to 2L sports bottles, all made with food-grade materials and 100% leak-tested before shipment. You’ll find competitive pricing, flexible MOQs, and rapid lead times designed for brands scaling up. I understand the importance of regulatory compliance, so we provide certification packs and barcode ready labeling. Whether you are in China or shipping globally, I tailor the production and logistics to your demand. I’m here to help you choose the best bottle design—clear, tinted, or frosted—plus caps, liners, and decorating options. Let's talk about your project and I’ll propose a plan that protects your brand and accelerates your market entry.
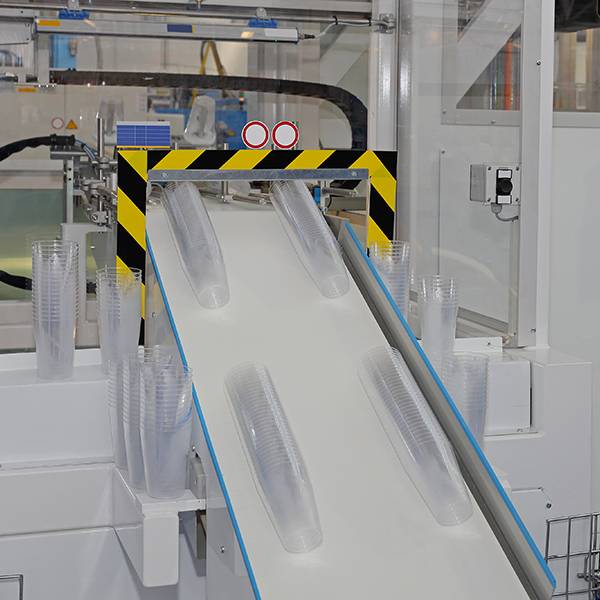
As a leading PET bottle supplier in China, our products combine advanced production capacity with strict quality control to meet the demands of global buyers. We offer a broad portfolio of food-grade, lightweight and durable bottles suitable for beverages, personal care and household chemicals, all produced to international safety and hygiene standards. High-efficiency lines and robust inspection systems ensure consistent delivery and competitive unit costs for large-volume contracts. Buyers benefit from flexible customization—shapes, sizes, colors, barrier coatings and printing options—alongside sustainable choices such as PCR content and fully recyclable designs. Fast tooling, responsive sample service and integrated logistics shorten lead times and simplify global sourcing. For companies seeking reliable packaging partners, our blend of innovation, cost-efficiency and supply-chain stability creates measurable value across markets.
| Metric | 2019 | 2020 | 2021 | 2022 | 2023 | 2024 (est) |
|---|---|---|---|---|---|---|
| Estimated PET bottle production in China (billion units) | 150 | 140 | 155 | 165 | 175 | 180 |
| China's share of global PET bottle volume (%) | 28% | 26% | 30% | 32% | 33% | 34% |
| rPET (recycled PET) share of domestic production (%) | 6% | 7% | 9% | 11% | 13% | 15% |
| Average mass per 500 mL bottle (grams) | 20 g | 19 g | 18 g | 17 g | 16.5 g | 16 g |
| Application mix (approx. % of domestic volume) | Beverages: 46% Water: 28% Food & condiments: 9% Pharma & cosmetics: 5% Others: 12% | Beverages: 45% Water: 29% Food & condiments: 9% Pharma & cosmetics: 5% Others: 12% | Beverages: 46% Water: 29% Food & condiments: 8% Pharma & cosmetics: 5% Others: 12% | Beverages: 45% Water: 30% Food & condiments: 8% Pharma & cosmetics: 5% Others: 12% | Beverages: 44% Water: 31% Food & condiments: 8% Pharma & cosmetics: 6% Others: 11% | Beverages: 43% Water: 32% Food & condiments: 7% Pharma & cosmetics: 6% Others: 12% |
| Share of production exported (%) | 35% | 30% | 33% | 34% | 34% | 33% |
| Primary export destinations (approx. 2023) | Europe: 30% • North America: 20% • Asia (excl. China): 35% • Other regions: 15% | |||||
| Light-weighting progress (average mass reduction vs 2019) | — | 5% | 10% | 15% | 17.5% | 20% |
| Estimated domestic recycling collection rate (%) | 18% | 20% | 23% | 26% | 28% | 30% |