PET Bottles

China PET Bottles Manufacturer | Leading Supplier for Brands

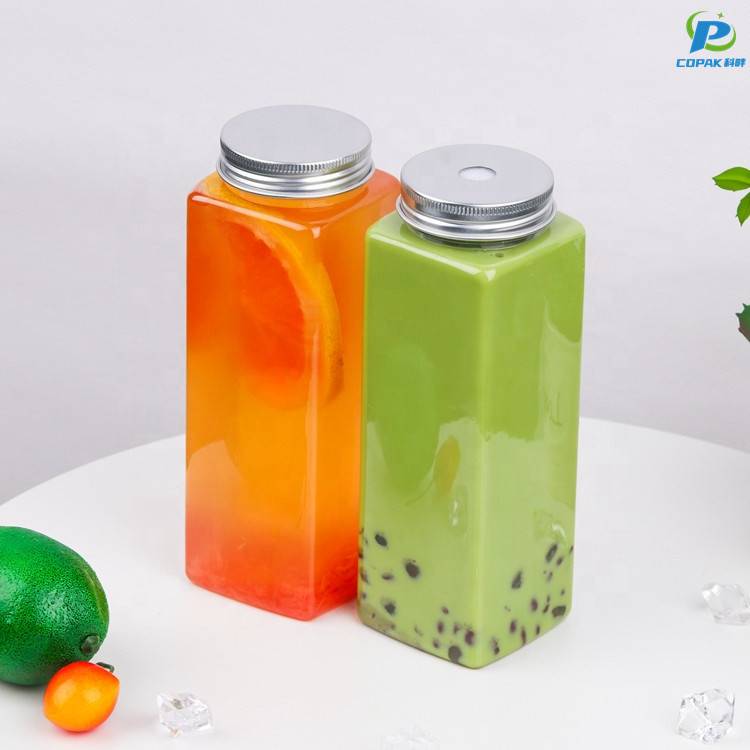
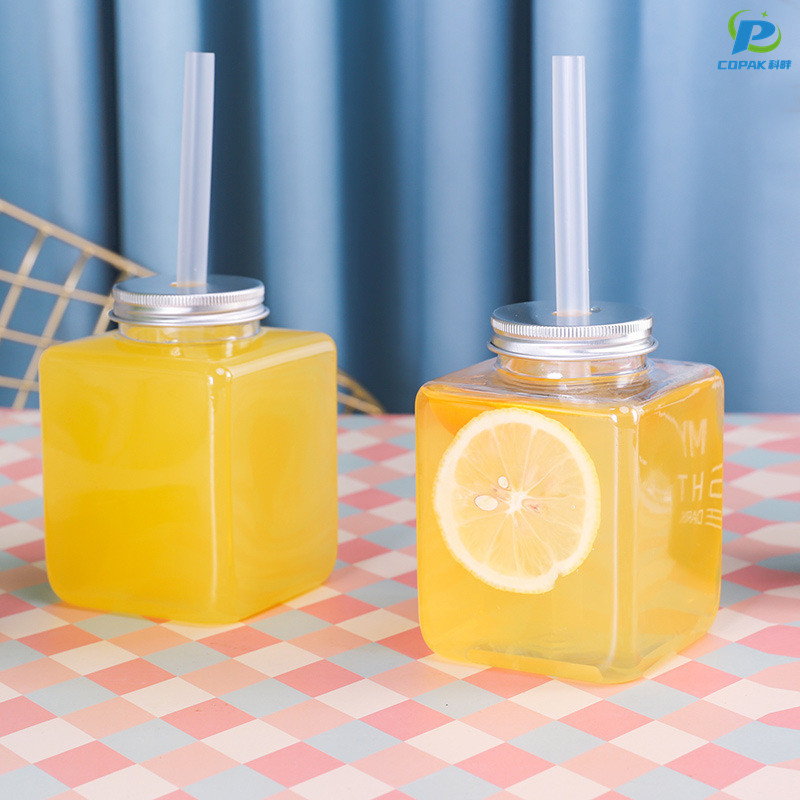
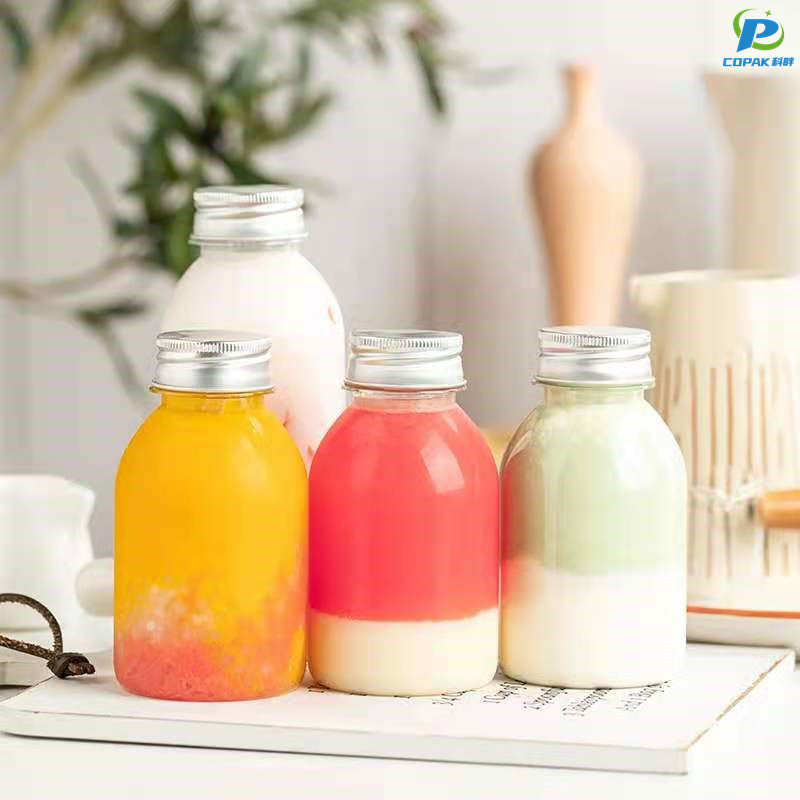
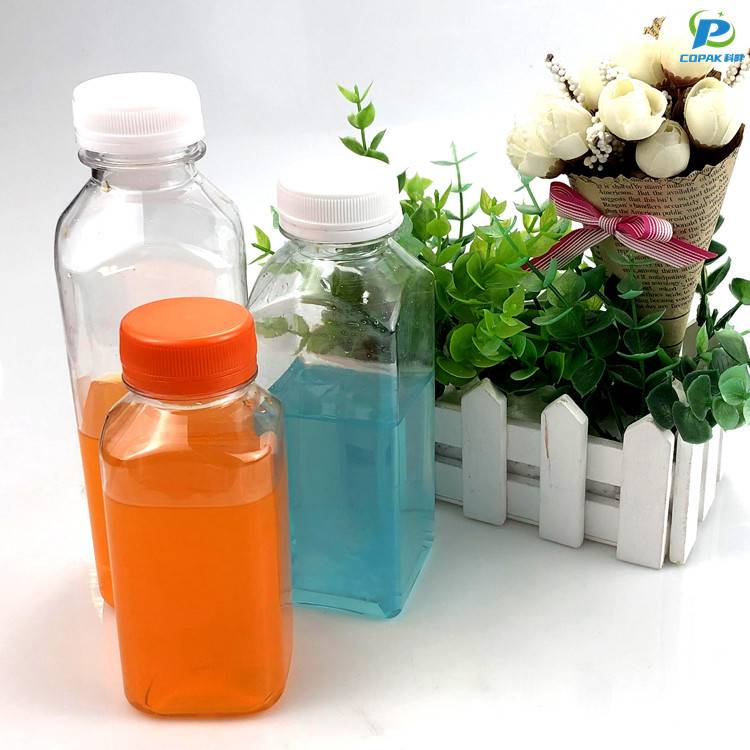
From our plant in China, I supply PET bottles that meet strict food-grade standards and tight tolerances. As a manufacturer with years in the field, I help brands and distributors who look for reliable packaging solutions. Our PET bottles come in 0.5L to 2L options, with narrow necks for sauces and wide mouths for CPG. They are light weight, shatter resistant, and crystal clear, with options for UV protection and hot-fill compatibility. We offer precise labeling, custom cap colors, and in-mold labeling. We maintain ISO certifications and can scale production to match your demand, with short lead times and flexible MOQ. If you are a buyer seeking China-based supplier, I am ready to partner with you to reduce cost per unit while maintaining quality. Contact me for samples and terms.

Hot Selling Product

PET bottles Ahead of the Curve Where Service Meets Innovation

Ahead of the curve, our PET bottles blend service with continuous innovation to meet global brand demands. Advanced lightweighting, superior barrier and clarity options, and food-grade recyclable resins reduce cost and environmental impact while preserving product integrity. Custom shapes, in-mold labels, and barrier treatments support beverages, cosmetics and household markets, all designed to meet international regulatory standards and evolving consumer expectations. We pair technical expertise with responsive service: rapid prototyping, precise color matching, flexible minimums, scalable production and rigorous quality control ensure reliable supply worldwide. End-to-end logistics coordination, sustainability roadmaps and collaborative product development make for a partner that helps brands accelerate time-to-market, improve shelf appeal and achieve measurable circularity.

{ PET bottles Ahead of the Curve Where Service Meets Innovation}
Attribute Typical value / range Unit Measurement / Standard Notes / Relevance
Material designation Polyethylene terephthalate (PET / PETE) ISO 1043 terminology Dominant clear beverage packaging resin; widely accepted for mechanical recycling.
Density / specific gravity 1.37 – 1.40 g/cm³ ASTM D792 (density) Affects material mass and transport footprint.
Glass transition temperature (Tg) 70 – 80 °C DSC (ASTM D3418) Defines service temperature limits for clear bottles.
Melting temperature (Tm) 250 – 260 °C DSC / processing data Processing window for extrusion/injection and re-melt.
Tensile strength (yield) 50 – 75 MPa ASTM D638 Orientation/crystallinity significantly affect values.
Elongation at break 20 – 200 % ASTM D638 Wide range due to molecular weight and processing; important for drop impact performance.
Water absorption (24 h) 0.15 – 0.30 % ASTM D570 Low moisture uptake; affects dimensional stability and barrier.
Oxygen transmission rate (OTR, 500 µm) 0.5 – 2.0 cm³·m⁻²·day⁻¹ ASTM D3985 Barrier depends on thickness and crystallinity; often adequate for short-life beverages.
Typical empty bottle mass (consumer formats) 9 – 25 (500 mL typical) g Weighing / production specs Lightweighting trends push toward lower mass while maintaining performance.
Typical crystallinity after processing 20 – 40 % DSC / XRD Impacts stiffness, clarity, and barrier properties.
Mechanical recycling yield (post-consumer) ~60 – 90 % mass recovery Industry processing data Yield depends on sorting quality, contamination, and washing efficiency.
Cradle-to-gate CO2 footprint (virgin resin) 1.5 – 3.0 kg CO₂e / kg resin LCA literature (typical ranges) Values vary by feedstock, electricity mix, and process efficiency; rPET lowers footprint.
Common manufacturing methods ISBM, EBM, Injection molding Process standards / machine data Choice affects cycle time, wall distribution and minimum achievable mass.
Recycling code PET / 1 International resin identification Key for sorting and curbside acceptance.
End-of-life collection / recycling (approx. by region) Europe ~60–70%; North America ~25–35%; Asia varies widely (20–50%) National / regional statistics (approx.) Collection and policy differences drive large regional variation.
Notes on innovation & service Lightweighting, increased rPET content, advanced sorting (near-infrared), and deposit/collection schemes are common levers used to improve circularity and lower lifecycle impacts.

Related Products

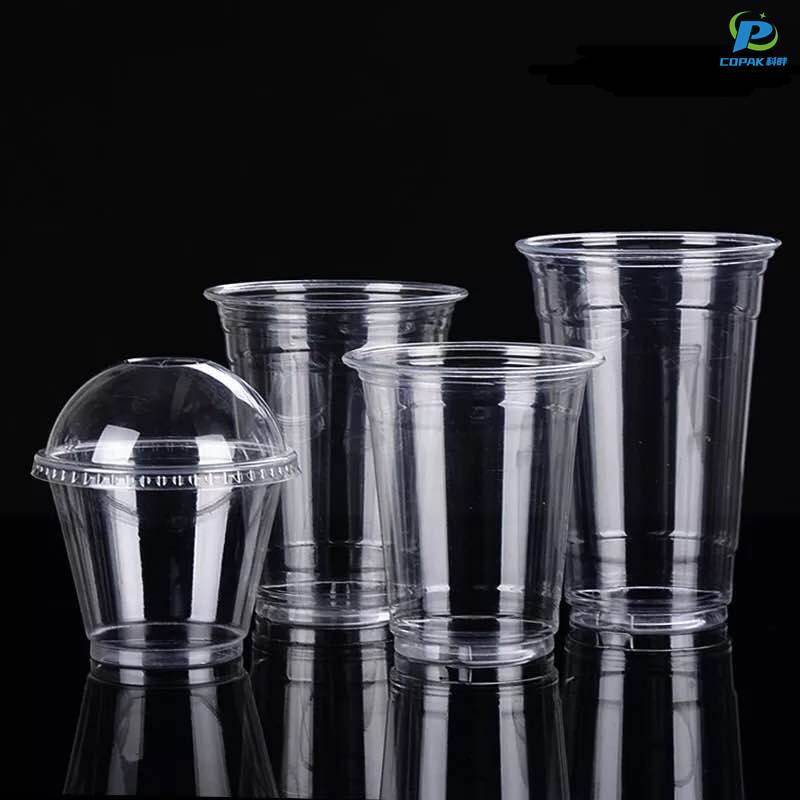
PET Cups

PET bottles Custom Solutions, More Than a Supplier - A Partner

Data Dimension: Sustainability Metrics Across Custom PET Bottle Solutions

Explanation: This chart presents a data dimension called Sustainability Metrics Across Custom PET Bottle Solutions. It aggregates six indicators: Recyclability Improvement, CO2e Reduction, Water Savings, Energy Reduction, Recycled Content, and Waste Reduction. Each bar represents a measured or estimated performance score on a 0-100 scale to enable comparative interpretation across different solution strategies. The numbers shown here are synthetic but designed to reflect plausible trade-offs encountered in packaging development, where improvements in one dimension can align with or trade off others.

Recyclability Improvement at 82 indicates enhanced end-of-life processing, compatibility with existing recycling streams, and simplified separation. CO2e Reduction at 68 signals meaningful reductions in greenhouse gas emissions during material production, molding, and transport when designers adopt lighter polymers, efficient molds, or optimized logistics. Water Savings of 57 reflects reductions in water use during manufacturing, cooling, and washing steps, while Energy Reduction at 74 demonstrates lower energy intensity through process optimization, heat recovery, and upgraded equipment. Recycled Content at 66 portrays the share of post-consumer or post-industrial recycled material incorporated, balancing mechanical performance with safety and food-contact requirements. Waste Reduction at 79 highlights improved material efficiency, reduced scrap, and lean production practices.

Together, the six metrics illustrate how a single product family can advance sustainability across multiple dimensions. The highest scores cluster around Energy Reduction and Waste Reduction, suggesting design choices that reduce energy consumption and material waste tend to yield broader benefits. Some trade-offs emerge: increasing recycled content may require process changes that affect recyclability or performance, so the chart helps stakeholders assess where to invest for the greatest overall impact. In practice, teams would collect real data from suppliers, production lines, and post-consumer recovery streams to populate comparable indicators over time. This visualization supports a partner-oriented discussion about aspirational targets, measurement plans, and continuous improvement, reinforcing that PET bottle solutions can be powered by collaboration rather than transactional supply relationships.

Top Selling Products

Subscribe To Our Newsletter

For inquiries about our products or pricelist, please leave your email to us and we will be in touch within 24 hours.

Follow Us

on our social media
  • whatsapp (1)
  • instagram
  • youtube