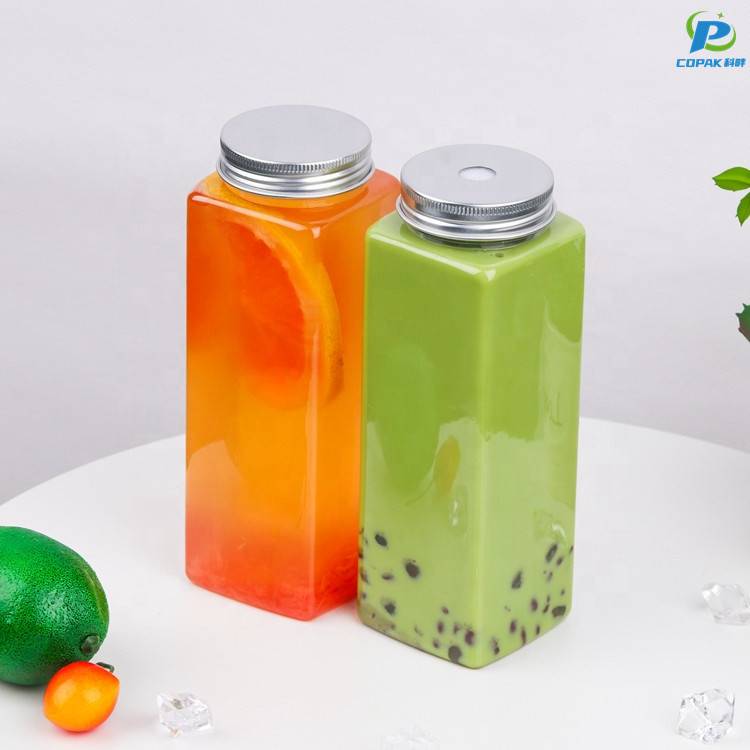
PET Bottles

PET CLEAR CANS - China Manufacturer for Packaging Solutions

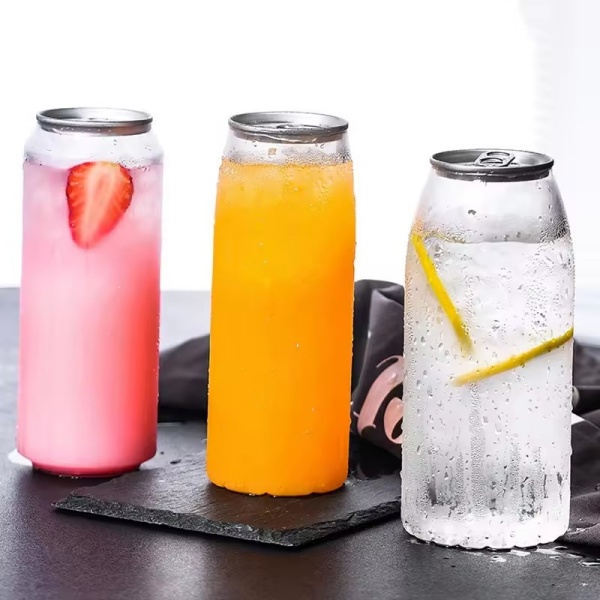
I’m a China-based manufacturer specializing in {PET CLEAR CANS}, and I know what B2B buyers expect. From our factory floor to your shelves, I deliver reliable supply, clear transparency, and consistent thickness options. Our {PET CLEAR CANS} combine high clarity, light weight, and excellent barrier properties, ideal for foods, beverages, cosmetics, and pet foods. I offer custom neck finishes, sizes, and volumes to fit your line, with tight tolerances and easy pop-off seals. Lead times are short, MOQ adjustable, and we can support private labeling. As a China manufacturer, I keep certs, QA docs, and test data ready. We also provide moisture and impact tests and corona treatment options to boost adhesion. If you need sustainable options, I can discuss recycled PET clear cans that meet your market’s regs. Partnering with us means predictable timing, direct pricing, and dedicated service reps to assist you from inquiry to shipment. Let’s turn your project into efficient, scalable packaging.

Hot Selling Product

PET CLEAR CANS Now Trending Leads the Global Market

PET clear cans are rapidly leading the global packaging market thanks to crystal clarity, lightweight strength and excellent barrier performance. Ideal for food, beverages, cosmetics and supplements, they boost shelf impact and consumer trust with tamper-evident lids, secure seals and high-quality labeling or direct printing options that showcase product color and texture. For global buyers aiming to scale, modern PET suppliers provide food-grade, BPA-free materials, FDA and EU compliance, PCR recycled options and flexible tooling for custom sizes and finishes. Consistent quality control, competitive pricing, fast lead times and coordinated international logistics make PET clear cans a smart, sustainable choice to elevate presentation and shorten time to market.

{ PET CLEAR CANS Now Trending Leads the Global Market}
Metric Value / Estimate Notes
Category definition Transparent polyethylene terephthalate (PET) rigid cans / jars used for food, beverage, and consumer products Clear appearance for shelf visibility; designed for reuse or mechanical/chemical recycling
Key material properties Density: ~1.37–1.39 g/cm³
Glass transition (Tg): ~67–80 °C
Melting point (Tm): ~250–260 °C
High clarity, good tensile strength and barrier vs. moisture; moderate CO2 barrier compared with PET variants
Primary end-use split (approx.) Beverage bottles: 50–55%
Food jars & containers: 15–20%
Personal care & cosmetics: 8–12%
Industrial & other packaging: 10–20%
Clear cans gain share in premium beverage and retail-ready foods due to visibility and perceived freshness
Global production (packaging-focused, est.) ~30 million metric tons per year (total PET resin production scale; packaging is a major portion) Figure refers to total PET resin output; packaging accounts for the largest share of demand globally
Market growth (forecast) CAGR ~4–6% (2024–2030) Growth driven by beverage demand, retail-ready packaging, and rising rPET initiatives
Regional production share (approx.) Asia-Pacific: ~60%
Europe: ~20%
North America: ~12%
Rest of world: ~8%
Asia-Pacific leads due to large chemical and polymer capacity and beverage market scale
Recycling & rPET uptake (regional estimates) Europe: ~50–60% bottle collection/recycling rates
North America: ~25–35% (varies by country/state)
Asia-Pacific: ~20–40% (wide variation by market)
rPET content in clear packaging averages ~15–25% globally; higher in regions with strong collection infrastructure
Carbon footprint range (cradle-to-gate) ~1.5–3.0 kg CO2e per kg PET (varies by virgin vs. recycled content) Higher recycled content reduces footprint; energy source and transport also influence values
Supply-chain considerations Stable resin availability but sensitive to feedstock costs and logistics Access to high-quality post-consumer bales influences rPET scalability for clear applications
Market drivers Consumer demand for transparency and convenience; regulatory push for recycled content; lightweighting Clear cans combine on-shelf appeal with lighter transport weight vs. glass
Risks & constraints Recycling contamination, CO2 barrier limitations for some beverages, regulatory variability by region Technical solutions (barrier coatings, multilayer approaches, chemical recycling) are active focus areas
Note: figures are approximate, reflecting common industry estimates and aggregated regional trends; actual values vary by country, year, and data source.

Related Products

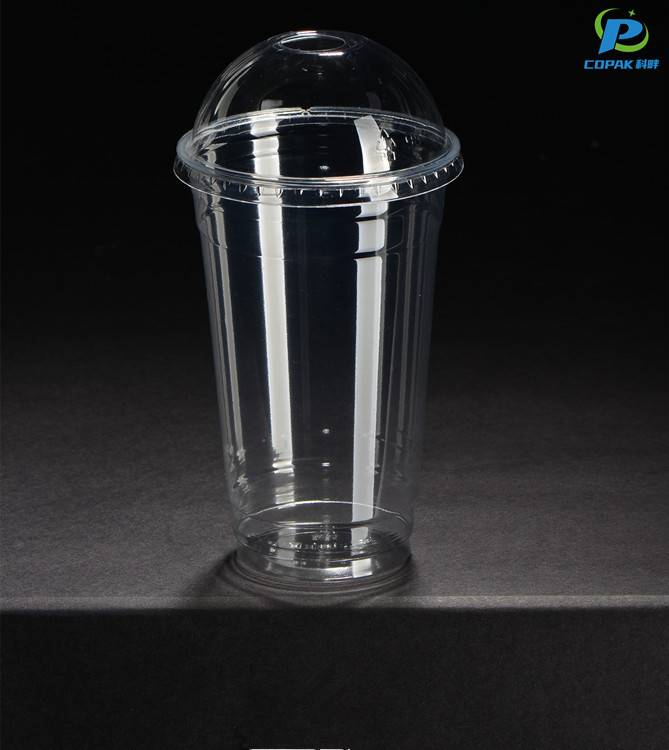
PET Cups

PET CLEAR CANS Winning in 2025 Where Innovation Meets 2025

PET Clear Can Adoption vs Innovation Index (2021–2025)

Between 2021 and 2025 the line chart tracks two interrelated dimensions for PET clear cans: Market Penetration (percentage of targeted retail segments adopting PET clear cans) and an Innovation Index (composite score from formulation, barrier performance, recyclability, and design tooling, scaled 0–100). The visualization shows steady growth in market penetration from 12% in 2021 to 38% in 2025, and a faster rise in the Innovation Index from 28 to 77 over the same period. This divergence suggests that technological and design advances are outpacing adoption, creating an expanding opportunity window for brands that can translate innovation into commercial value and consumer acceptance.

Key drivers behind the Innovation Index growth include improved barrier coatings, thinner-walled manufacturing that reduces material use, and enhanced transparency and printability that improve shelf visibility. Secondary drivers are regulatory pressure and rising consumer preference for recyclable solutions. Market Penetration lags because adoption requires supply chain adjustments, validation at scale, and retailer shelf acceptance. The chart highlights a pivotal year around 2024 where the Innovation Index accelerates; this inflection likely corresponds to scalable process improvements and wider availability of sustainable additives.

For stakeholders, the data implies three practical priorities: accelerate pilot-to-scale transitions by investing in tooling and quality assurance; communicate innovation benefits clearly to retailers and end consumers, focusing on performance parity or advantage; and participate in circularity programs to close the feedback loop and reduce perceived risk. Monitoring both dimensions provides a balanced view: high innovation without commensurate penetration increases stranded investment risk, while penetration without innovation risks commoditization and margin pressure. By tracking these metrics annually, companies can time commercialization, prioritize R&D investments, and design go-to-market strategies that convert technological progress into tangible market share. Regularly updating the dataset with pilot results and recycling yield metrics will refine projections and improve decision accuracy and execution timelines.

Top Selling Products

Subscribe To Our Newsletter

For inquiries about our products or pricelist, please leave your email to us and we will be in touch within 24 hours.

Follow Us

on our social media
  • whatsapp (1)
  • instagram
  • youtube