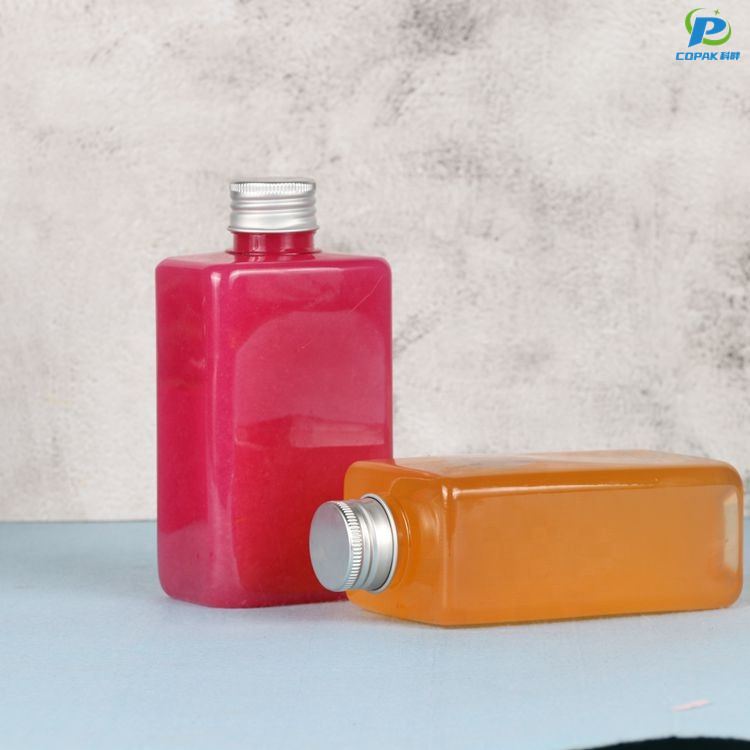
PET Bottles

China Manufacturer of 16 Oz PET Plastic Bottles

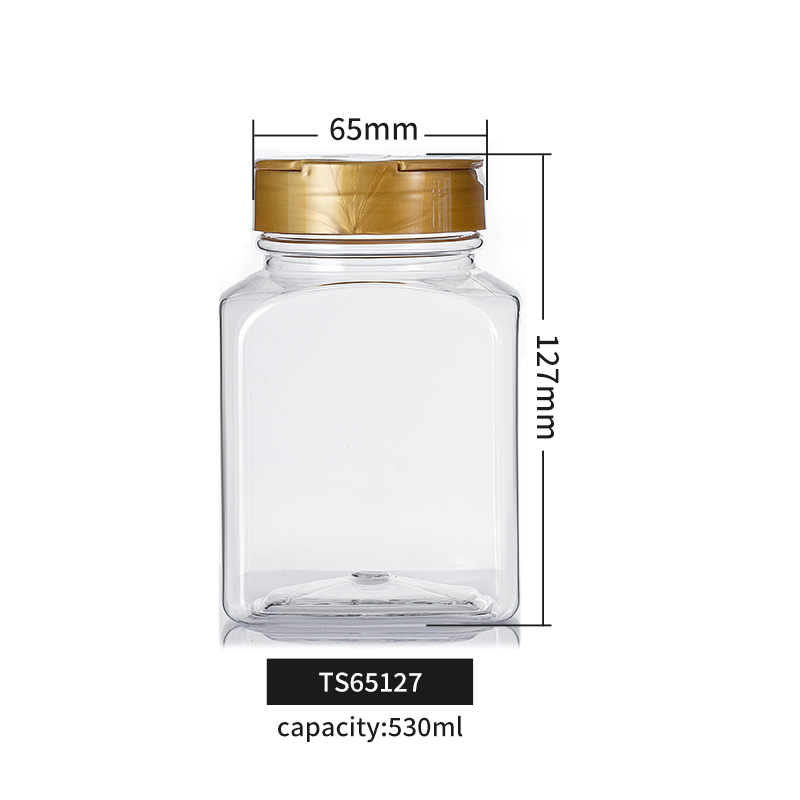
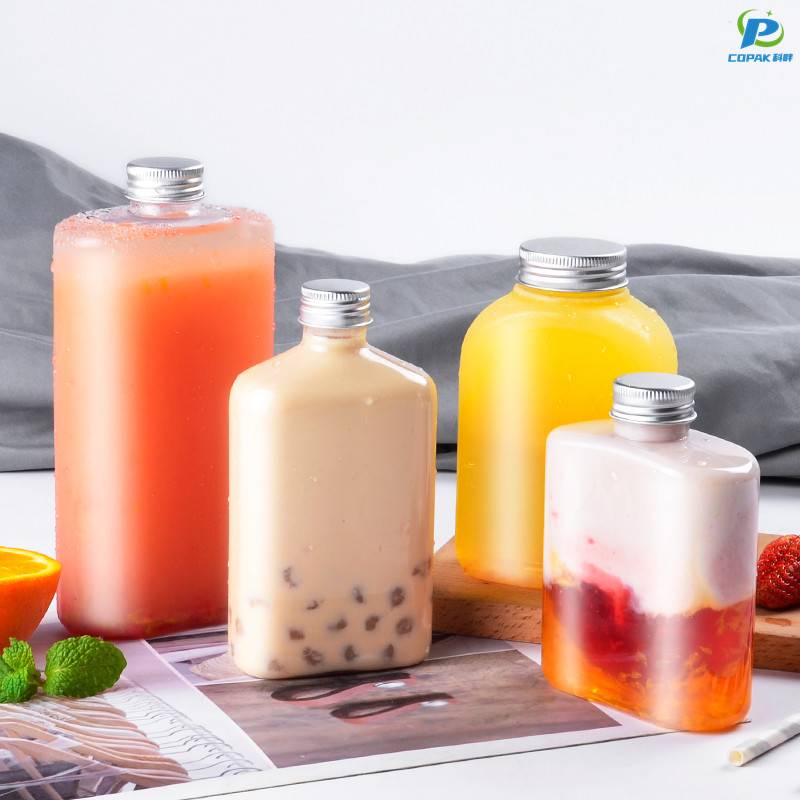
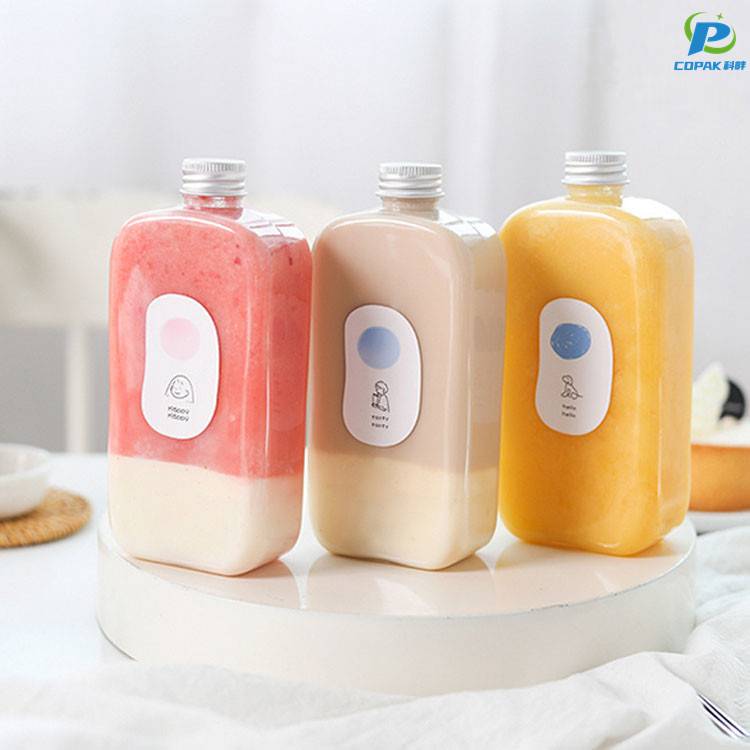
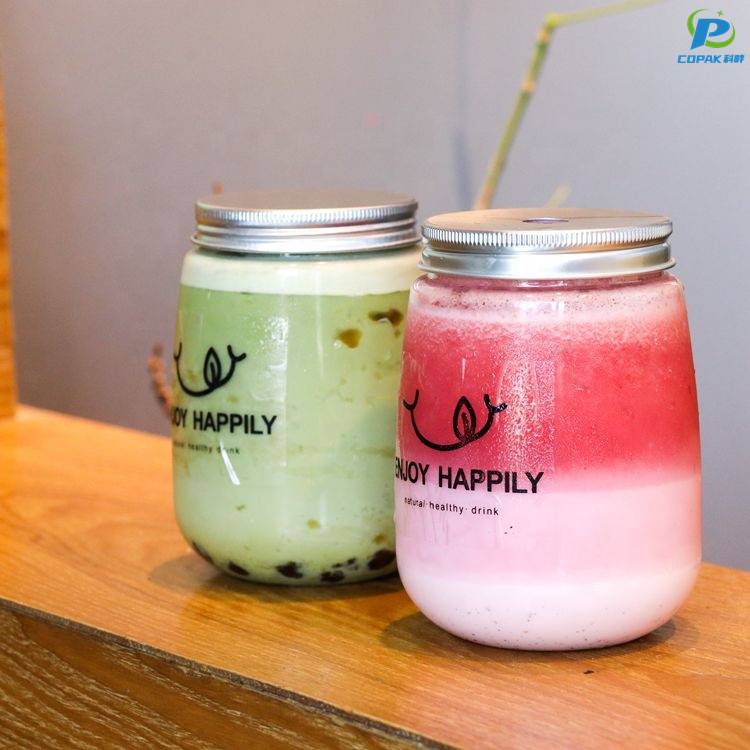
I am a China-based manufacturer ready to meet your bulk packaging needs with 16 Oz PET Plastic Bottles. These bottles are lightweight, shatter resistant, and crystal clear to boost product visibility. They fit a wide range of liquids—from cosmetics to beverages and sauces—and can be customized with different caps, neck finishes, and labeling options. For B2B buyers, we offer competitive bulk pricing, steady supply, and short lead times. We keep tight quality control to ensure consistency across large orders, and we welcome OEM/ODM collaborations to match your brand. We can ship directly from our factory, reducing transit times and costs. Tell me your required volume and cap type; I’ll tailor a solution that meets your spec. If you’re sourcing from China for a reliable manufacturer, I’m confident we can support your growth.

Hot Selling Product

16 Oz PET Plastic Bottles Market Leader Your End-to-End Solution

As a market leader in 16 oz PET plastic bottles, we deliver premium, cost-effective packaging for beverages, sauces, cosmetics and more. Our bottles combine lightweight durability, excellent clarity and food-grade safety, available in standard and custom shapes with multiple neck finishes, tamper-evident options and advanced barrier coatings. Decoration choices include hot-stamp, labeling, silk-screen and full-color sleeves, with color matching and custom molds to accelerate brand differentiation. Providing a true end-to-end solution, we handle design, prototyping, tooling, production, quality control and global logistics to ensure consistent on-time deliveries at competitive MOQs. Manufacturing adheres to international food-contact and quality standards, and sustainable options like rPET/PCR are available to meet regulatory and consumer demands. Global buyers gain fast samples, scalable capacity and transparent supply-chain support to simplify sourcing and grow their brands.

{ 16 Oz PET Plastic Bottles Market Leader Your End-to-End Solution}
Dimension Metric Typical Value / Range Notes
Product Volume Nominal liquid capacity 16 fl oz (473 mL) Standard consumer single-serve size
Material Polymer type PET (Polyethylene Terephthalate) Widely used for beverages and liquid foods
Typical Empty Bottle Weight Mass per bottle (empty) 9 – 13 g Lightweighting varies by design and application
Material Density Bulk density of PET ~1.38 g/cm³ Standard value used for weight and mass calculations
Wall Thickness Average body thickness 0.25 – 0.35 mm Design-dependent; affects rigidity and barrier
Manufacturing Method Primary forming technology Injection Stretch Blow Molding (ISBM) Common for high-throughput, consistent quality
Production Throughput Typical ISBM line output 8,000 – 24,000 bottles/hour per line Line speed depends on preform size and machine model
Typical Applications End-use categories Bottled water, juices, ready-to-drink tea, sports drinks, liquid condiments Versatile for non-carbonated beverages and some food liquids
Barrier Properties Oxygen & moisture performance Low oxygen/moisture barrier; improved with coatings or multi-layer solutions Suitable for many non-carbonated liquids; carbonated products require thicker designs
Food Contact & Safety Regulatory compliance Compliant with major food-contact regulations (e.g., FDA, EU food contact frameworks) Material commonly accepted for direct food contact when processed properly
Recyclability & rPET Use Post-consumer recycling and reuse Typical rPET blends: 15%–50% (food-grade applications vary) Regional recycling access and processing determine achievable rPET content
Regional Recycling Rates (recent) Representative recovery rates EU: ~60% • North America: ~30% • China: ~50% • Global avg: ~45% Rates vary year-to-year and by collection systems
Life‑Cycle Carbon Footprint Estimated cradle-to-grave GHG ~80 g CO2e per 473 mL bottle (average life-cycle estimate) Value depends on production, transport, fill, and end-of-life scenario
Typical Shelf Life (Unopened) Expected stability for beverages 6 – 12 months (non-carbonated up to 12–18 months depending on formulation) Storage conditions and formulation affect actual shelf life
Transport & Palletization Common logistics metrics Typical pallet capacity (24-pack configurations): ~3,600 – 4,800 bottles per standard pallet Depends on pack pattern, layer count, and pallet footprint
Quality & Test Methods Common QC parameters Visual inspection, burst/pressure tests, dimensional control, contaminant screening Routine testing ensures fill-line compatibility and consumer safety

Related Products

Eco Friendly Products

16 Oz PET Plastic Bottles Dominates Ahead of the Curve

Regional Market Share Trends for 16 oz PET Bottles (2021–2026)

This chart visualizes a hypothetical regional market-share trend for 16 oz PET plastic bottles between 2021 and a near-term 2026 outlook. The dataset separates major regions to highlight differentiated trajectories: Asia-Pacific shows the strongest growth, climbing from roughly one-third of the market toward a dominant share by 2026 driven by rapid single-serve beverage consumption, expanding retail channels, and large population bases. North America displays steady gains as manufacturers optimize lightweight designs and convenience packaging, increasing adoption in ready-to-drink categories. Europe is comparatively stable with modest year-on-year increases reflecting a balance between demand for convenience and regulatory pressure to increase recycled-content and curb single-use plastics. The Latin America & Rest of World series in this model declines, representing a combination of shifting supplier focus, local material constraints, and policy-driven substitution in specific markets. Interpreting these trends, stakeholders should note that rising market share in Asia-Pacific and North America implies growing requirements for PET supply, recycling infrastructure, and rPET feedstock. Opportunities exist in lightweighting, improved collection and deposit schemes, and partnerships to scale closed-loop recycling. Risks include regulatory shifts that accelerate substitution to alternative materials, supply-chain disruptions for virgin PET, and brand-owner sustainability commitments that change demand composition. When using such a chart for planning, combine the visual trends with scenario analysis on policy, raw-material pricing, and consumer preference shifts to form robust capacity and sustainability strategies.

Top Selling Products

Subscribe To Our Newsletter

For inquiries about our products or pricelist, please leave your email to us and we will be in touch within 24 hours.

Follow Us

on our social media
  • whatsapp (1)
  • instagram
  • youtube