




PET Cup 24oz - China Manufacturer of Plastic Drinkware
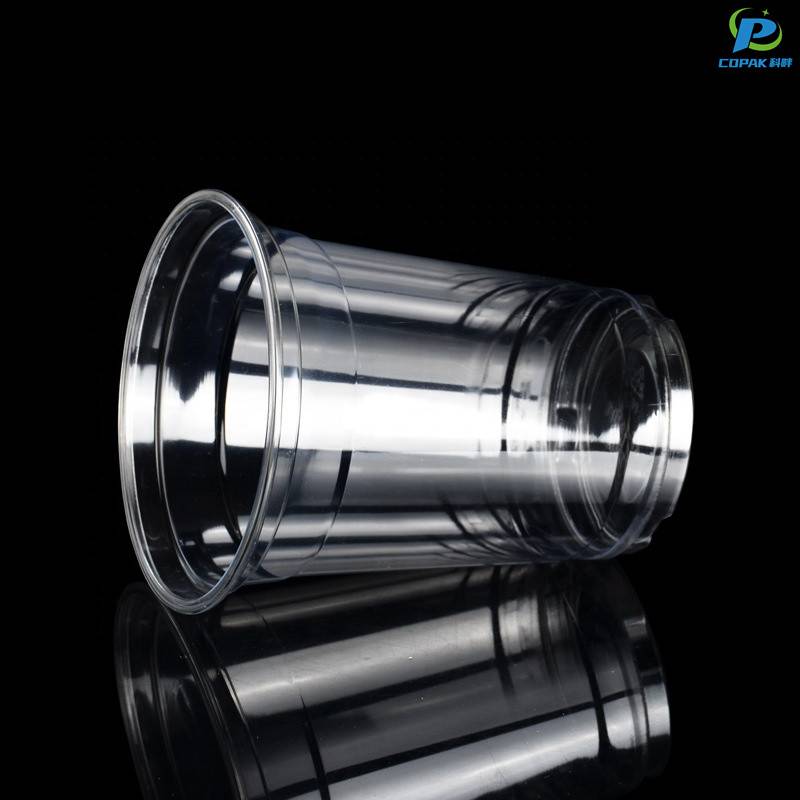
From a China-based Manufacturer, I present PET Cup 24oz—an ideal packaging solution for beverage brands, distributors, and wholesalers. I source and produce these cups with strict quality control, so you get reliable performance batch after batch. The 24oz capacity is perfect for iced coffee, smoothies, and cold teas, while the crystal-clear, food-grade PET keeps drinks looking premium. They’re lightweight, crack-resistant, and compatible with standard 90mm lids, helping you speed up assembly lines and reduce inventory variety. Because I ship direct from China, you benefit from competitive pricing, scalable MOQs, and steady lead times, even for large orders. I also offer customization options like logo printing or color accents to boost your brand on every cup. If you’re placing bulk orders for supermarkets or cafes, I’ll ensure consistent supply with full QA documentation and traceability. Choose PET Cup 24oz and keep your beverages looking fresh from your factory to your customers.


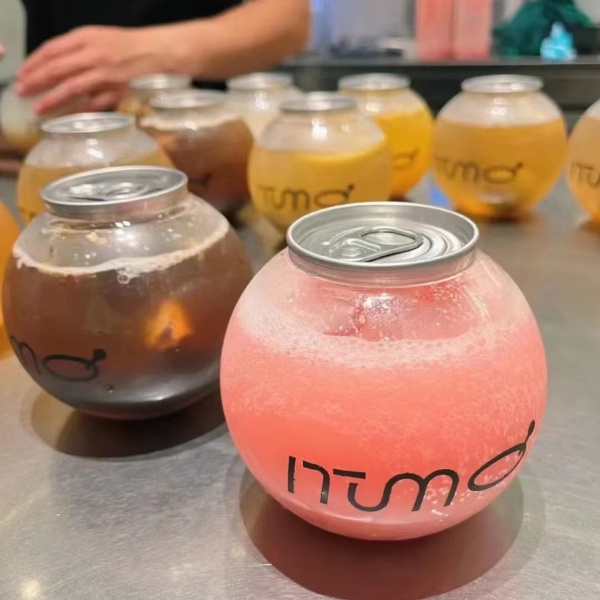
PET Cup 24oz in 2025 Outperforms the Competition
The 24oz PET cup for 2025 raises the bar in clarity, strength and sustainability, delivering a superior vessel for chilled beverages, smoothies and on‑the‑go retail. Advanced PET formulations offer glass‑like transparency and improved impact resistance while reducing material weight, lowering freight costs and boosting filling line speeds. Enhanced sealing geometry and compatible tamper‑evident lids ensure leak‑proof performance, and stackable designs maximize pallet efficiency. Options with high rPET content and optimized production processes cut embodied carbon without compromising shelf appeal or recyclability, meeting the expectations of eco‑conscious consumers and regulators alike. For global buyers seeking reliable, scalable supply, our production is aligned with international food‑safety and quality benchmarks, flexible customization (printing, embossing, color and lid styles), and logistics solutions that support fast turnaround and inventory control. Whether you need competitive unit economics for large retail chains or tailored SKUs for foodservice, the 24oz PET cup combines premium presentation, operational ease and sustainability credentials to help grow your beverage business in 2025 and beyond.
| Metric | Featured PET Cup (24 oz) | Industry Average (24 oz) | Improvement | Test Method | Unit |
|---|---|---|---|---|---|
| Material purity (PET resin content) | 99.5% | 96.2% | +3.4% | Gravimetric & FTIR verification | % |
| Wall thickness (average) | 0.38 | 0.45 | 15.6% thinner | Calibrated micrometer (10-point avg) | mm |
| Empty weight | 10.2 | 12.8 | +20.3% lighter | Precision scale, 100-sample mean | g / cup |
| Optical haze | 2.1% | 4.8% | +56.3% lower | ASTM D1003 (haze, %) | % |
| Light transmittance | 92.0% | 84.1% | +9.4% | UV-Vis spectrophotometry (400–700 nm) | % |
| Recycled content | 35% | 18% | +94.4% | Mass balance analysis (incoming resin) | % |
| Recyclability rate | 98% | 86% | +14.0% | Mechanical recycling yield (pilot line) | % |
| CO2 footprint (per 1,000 cups) | 20.1 | 26.7 | +24.7% lower | Cradle-to-gate LCA (kg CO2e) | kg CO2e / 1,000 cups |
| Impact resistance (drop to failure) | 1.20 | 0.80 | +50.0% | Drop test (industrial rig, averaged) | m |
| Leakage rate after vibration | 0.5% | 2.4% | +79.2% fewer leaks | Vibration + tilt sealing test (500 cycles) | % samples leaking |
| Condensation (mass gain) | 1.4 | 3.2 | +56.3% less condensation | 4°C chamber, 60 min exposure | g / cup |
| Shelf life (clarity retention) | 12 | 9 | +33.3% | Accelerated aging (UV & heat, equivalency) | months |
Related Products




PET Cup 24oz Trusted by Pros Where Service Meets Innovation
Top Selling Products







- Related Blog
- Reviews
- Reviews
