




PET Juice Cup - China Manufacturer of PET Beverage Cups
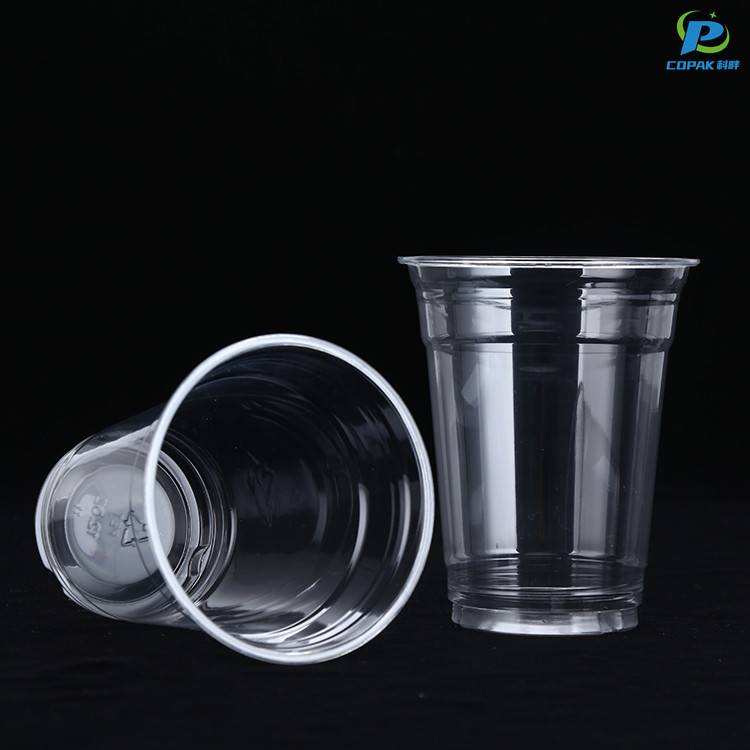
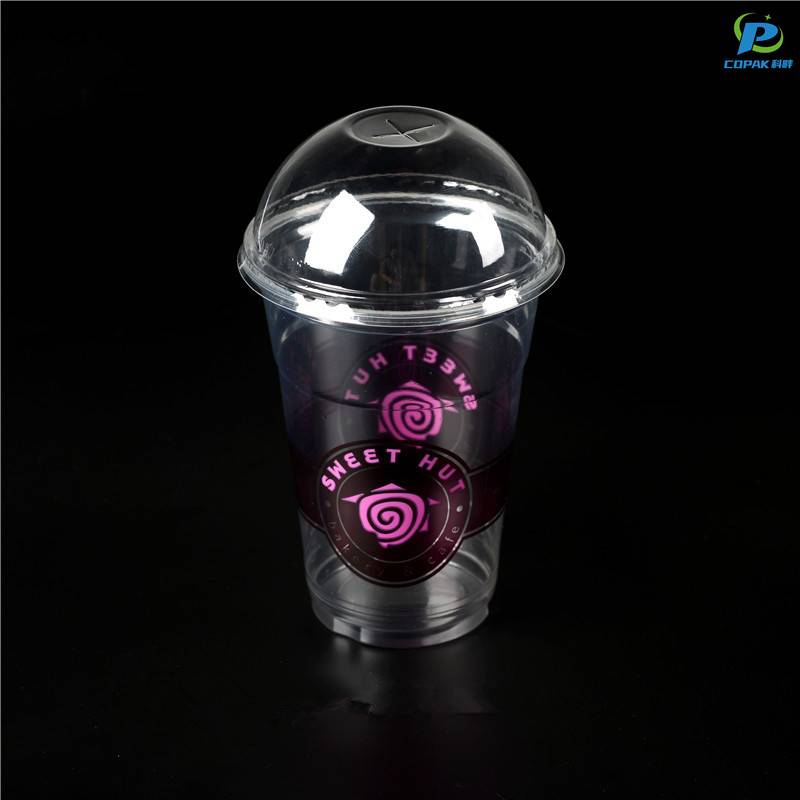
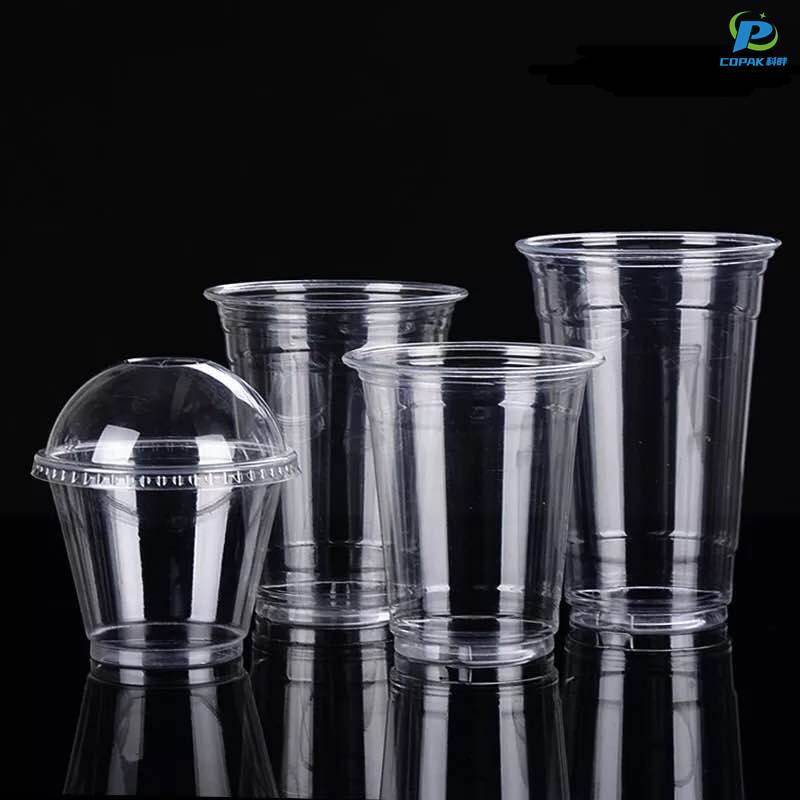
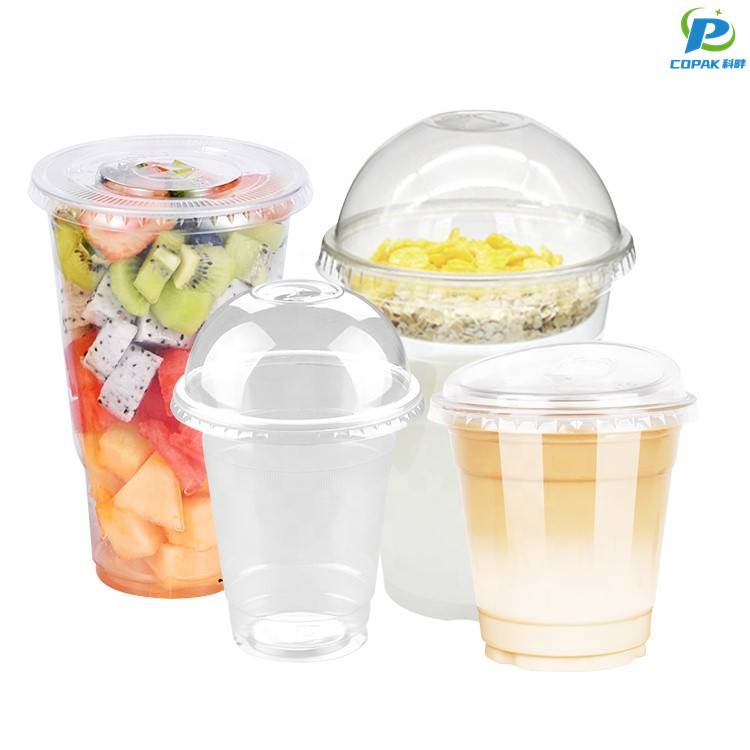
As a China-based manufacturer, I supply PET Juice Cup solutions tailored for beverage brands, distributors, and retailers. Crafted from food-grade PET and BPA-free resin, these cups meet safety standards for cold drinks, smoothies, and iced teas. The crystal-clear walls showcase your colors and logo, while leak-proof lids keep contents secure from factory to customer. With lightweight design and stackable geometry, they reduce logistics costs and save space in storage. We offer private-label options, multiple capacities (150ml, 200ml, 250ml, 300ml), customizable printing, and cap colors to match your brand. Flexible MOQs and short lead times suit growing businesses, and we manage strict QC checks throughout production to ensure consistency. Stable supply from a reputable China-based manufacturer means steady orders for your network worldwide. We export to clients in China and abroad with on-time delivery and trusted certifications. If you need bilingual labeling, rapid re-packaging, or detailed dimensional tolerances, I tailor the solution to your project.



PET Juice Cup Trusted by Pros Where Service Meets Innovation
Professionally engineered PET juice cups combine crystal-clear presentation with food-safe performance, making them the preferred choice for beverage brands, caterers, and retail chains worldwide. Lightweight yet durable, these cups resist cracking, provide excellent barrier properties for freshness, and are compatible with tamper-evident lids and multiple filling systems. Their high clarity showcases color and pulp, while available rPET options support sustainability goals without sacrificing functionality. Backed by a Shanghai-based manufacturing partner with advanced production lines and rigorous quality control, global buyers benefit from flexible customization, low minimum orders, and reliable lead times. Services include bespoke printing, sizing, certification support (FDA/EU), and coordinated logistics for worldwide delivery. For procurement teams seeking a balance of innovation, consistent quality, and responsive service, these PET juice cups deliver scalable, cost-effective solutions that meet modern market demands.
| Variant | Material Composition | Capacity (mL) | Avg Weight (g) | Bottom Thickness (mm) | Transparency (%) | Temp Range (°C) | Lid Compatible | Leak Resistance (0–10) | Recyclability (%) | PCR Content (%) | Typical Use Cases | Food‑contact Compliance | Manufacturing Method | CO2e per 1000 units (kg) | Recommended Shelf Life |
|---|---|---|---|---|---|---|---|---|---|---|---|---|---|---|---|
| Standard Clear 250 mL | 100% PET (virgin) | 250 | 6.5 | 0.8 | 92 | -10 to 60 | Yes | 7 | 98 | 0 | Cold beverages, samples, tasting cups | Compliant with FDA 21 CFR 177.1520; EU 10/2011 | Thermoforming (sheet) | ≈16 | 2 years |
| Tall Clear 350 mL | 100% PET (virgin) | 350 | 8.5 | 0.9 | 91 | -10 to 60 | Yes | 7 | 98 | 0 | Smoothies, juices, fountain drinks | Compliant with FDA 21 CFR 177.1520; EU 10/2011 | Thermoforming (sheet) | ≈21 | 2 years |
| Reinforced 500 mL | PET with structural ribs (virgin) | 500 | 13 | 1.2 | 88 | -10 to 60 | Yes | 8 | 96 | 0 | Large cold drinks, event service | Compliant with FDA & EU food-contact rules | Injection/thermoforming hybrid | ≈33 | 2 years |
| Insulated Double‑wall 350 mL | Dual-wall PET (air-gap insulation) | 350 | 14 | 1.5 (outer) | 80 | -10 to 70 | Yes | 8 | 85 | 0 | Cold drinks needing thermal retention | Compliant with FDA & EU food-contact rules | Multi-layer thermoforming | ≈35 | 2 years |
| Eco PCR 300 mL | 70% PCR PET / 30% virgin PET | 300 | 8 | 0.9 | 88 | -10 to 60 | Yes | 7 | 90 | 70 | Sustainable events, cafes, takeaway | Compliant with FDA & EU food-contact rules (PCR in accordance with guidance) | Thermoforming with recycled feedstock | ≈13 | 2 years |
| High‑Temp 250 mL | Heat-stabilized PET copolymer | 250 | 7 | 1.0 | 85 | -20 to 90 | Yes | 8 | 92 | 0 | Hot-fill applications, pasteurized juices | Compliant with FDA & EU food-contact rules (heat-stable grades) | Injection molding with heat stabilization | ≈18 | 2 years |
Related Products



PET Juice Cup Supplier Factory
Top Selling Products








- Related Blog
- Reviews
- Reviews
