




PET Portion Cups With Lids — China Manufacturer
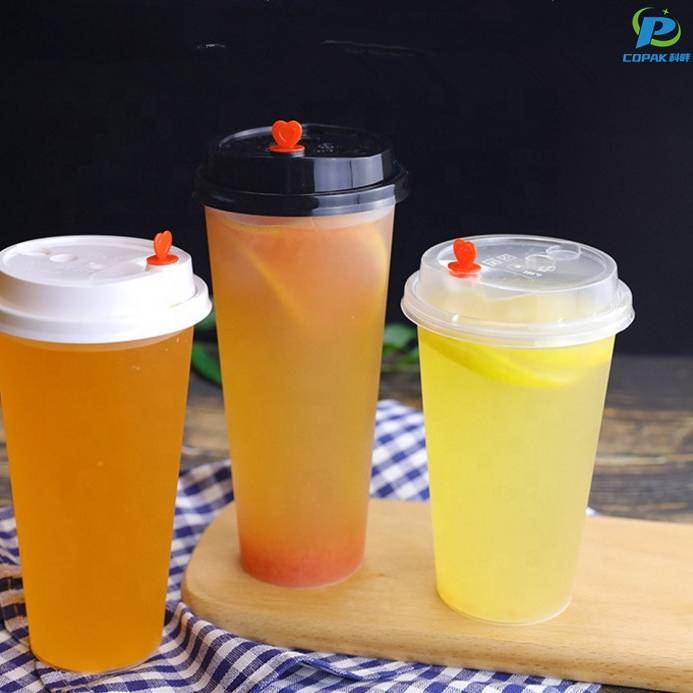
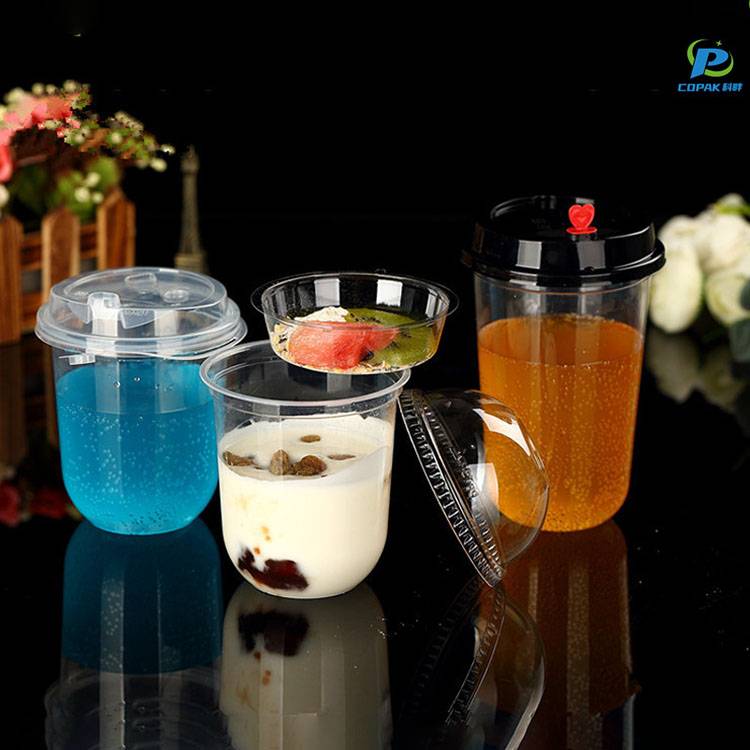
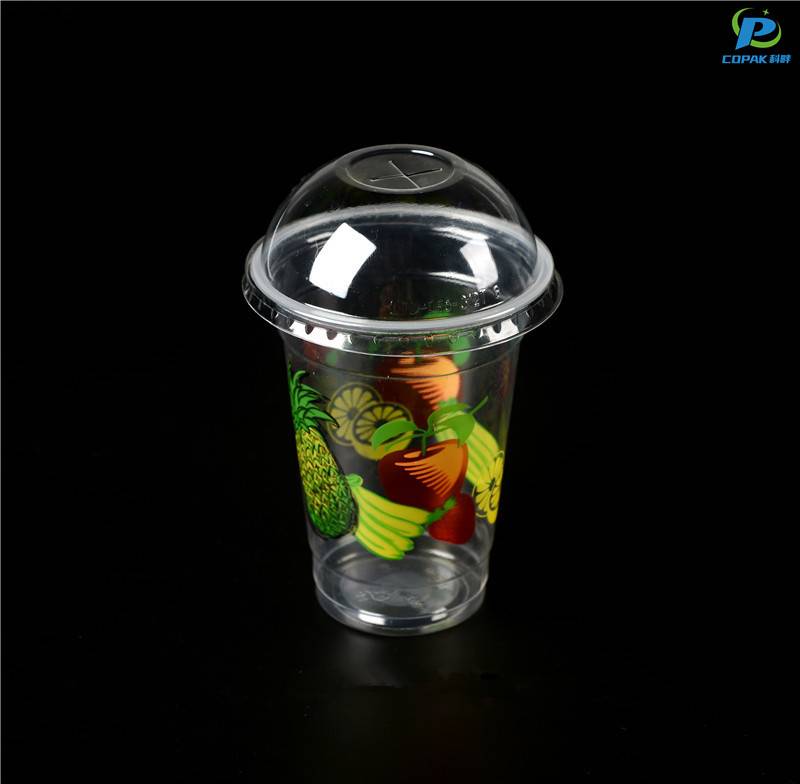
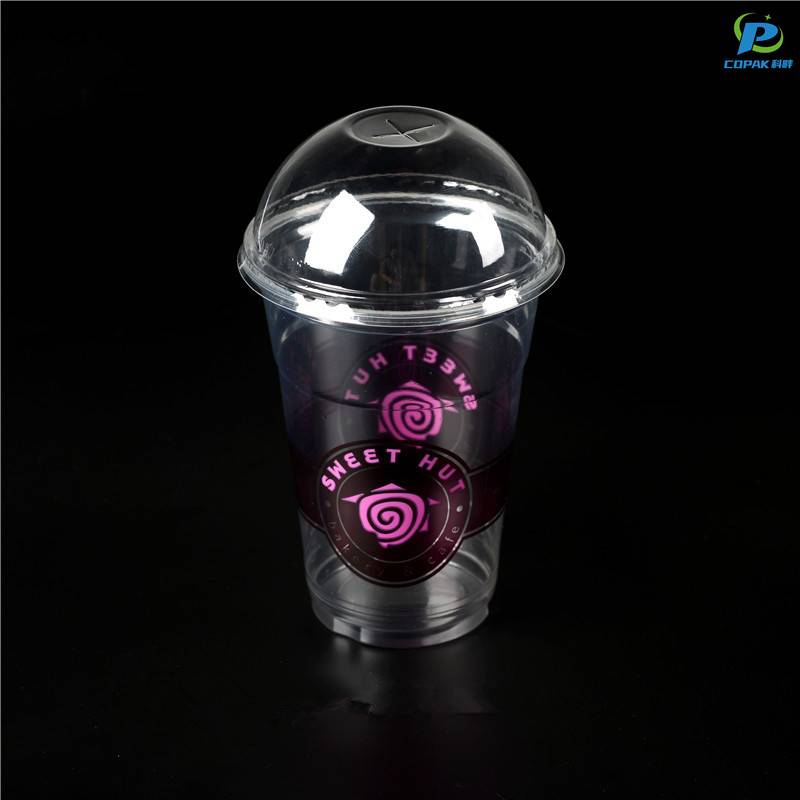
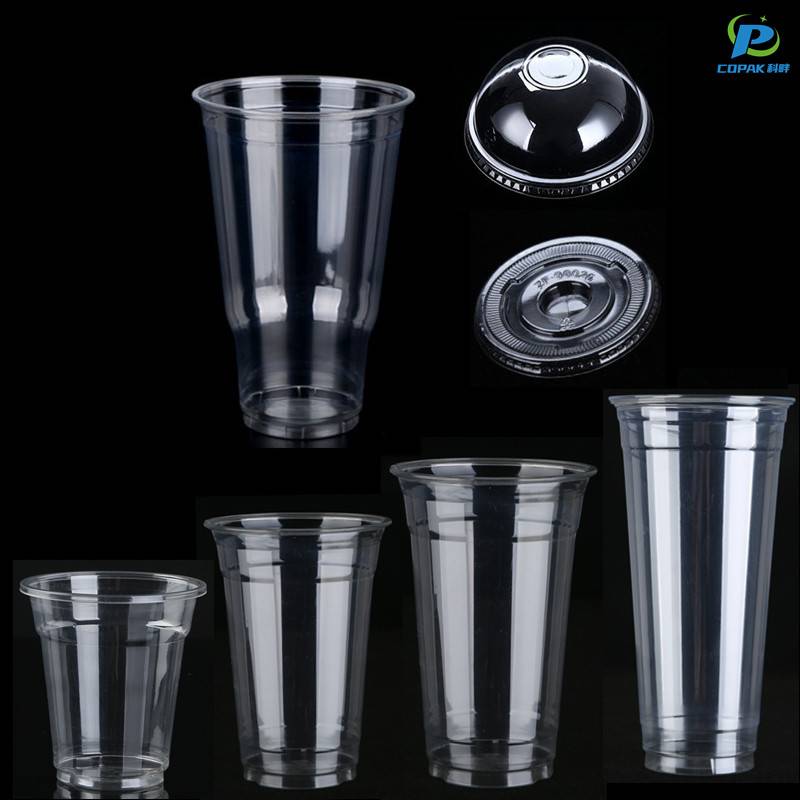
From our production line in China, I supply PET Portion Cups With Lids that meet the high demands of food-service buyers. As a China-based manufacturer, I know what you need: reliable supply, consistent quality, and clear branding options. Our PET Portion Cups With Lids are food-grade, BPA-free, and crystal clear, with tight-sealing lids to prevent leaks during transport. They are stackable, lightweight, and compatible with standard cup carriers, making them ideal for take-away, catering, and portion-control programs. Available in multiple sizes, transparent appearance helps showcase product contents, boosting impulse sales. We offer customization, low MOQs for trials, and scalable production to support growing chains. If you’re seeking steady supply, quick lead times, and competitive pricing, I can meet your needs as your trusted manufacturer. Contact me to discuss carton counts, lid colors, and print options. Let me help you streamline packaging while keeping costs under control.



PET Portion Cups With Lids Factory Guarantees Peak Performance
As global demand for convenience packaging soars, PET portion cups with lids produced by a Shanghai-based factory deliver reliable, food-safe performance for sauces, snacks, desserts and single-serve meals. Precision forming and tooling ensure uniform wall thickness, crystal clarity and tight, leak-resistant seals; lids are engineered for easy peel, secure snap and tamper evidence to protect product integrity throughout storage and distribution. Buyers benefit from supplier guarantees including rigorous quality control, compliance with international food-safety standards and consistent run-to-run performance backed by automated production and laboratory testing. Flexible customization (sizes, colors, printing, rPET), competitive lead times, scalable capacity and optimized packaging make these portion cups an efficient choice for retailers, foodservice operators and private-label brands seeking dependable supply and peak performance in global markets.
{ PET Portion Cups With Lids Factory Guarantees Peak Performance}
| Capacity (ml) | Diameter (mm) | Height (mm) | Wall Thickness (mm) | Lid Type | Transparency | Recyclability | Food Contact Compliance | Typical Use |
|---|---|---|---|---|---|---|---|---|
| 30 | 45 | 20 | 0.18 | Snap-fit | ≈90% | PET (1) | FDA 21 CFR 177.1630; EU No 10/2011 | Condiments, single-serve sauces |
| 50 | 55 | 22 | 0.20 | Snap-fit | ≈91% | PET (1) | FDA 21 CFR 177.1630; EU No 10/2011 | Dips, dressings, sample portions |
| 90 | 63 | 30 | 0.22 | Heat-sealable (peelable) | ≈90–92% | PET (1) | FDA 21 CFR 177.1630; EU No 10/2011 | Sauces, dressings, meal components |
| 150 | 75 | 42 | 0.25 | Snap-fit / Tamper-evident | ≈89–91% | PET (1) | FDA 21 CFR 177.1630; EU No 10/2011 | Portion-controlled desserts, salads |
| 200 | 80 | 50 | 0.28 | Snap-fit | ≈89% | PET (1) | FDA 21 CFR 177.1630; EU No 10/2011 | Prepared food portions, grab-and-go |
| 250 | 90 | 55 | 0.30 | Snap-fit / Hinged available | ≈88–90% | PET (1) | FDA 21 CFR 177.1630; EU No 10/2011 | Yogurt, cold desserts, salads |
| 350 | 100 | 65 | 0.35 | Snap-fit | ≈88% | PET (1) | FDA 21 CFR 177.1630; EU No 10/2011 | Meal components, deli items |
| 500 | 115 | 75 | 0.40 | Snap-fit (reinforced rim) | ≈87–89% | PET (1) | FDA 21 CFR 177.1630; EU No 10/2011 | Larger ready meals, bulk portions |
- Typical thermal limit (short exposure): up to ≈60°C; not recommended for microwave use.
- Dimensional production tolerance: generally ±2.5%–±4% depending on size and tooling.
- Suggested shelf life for sealed products: commonly 12–24 months depending on barrier lid and storage conditions.
Related Products





PET Portion Cups With Lids Industry Leaders Exceeds Industry Benchmarks
Top Selling Products




- Related Blog
- Reviews
- Reviews
