




PET Cylinder Bottles - China Manufacturer
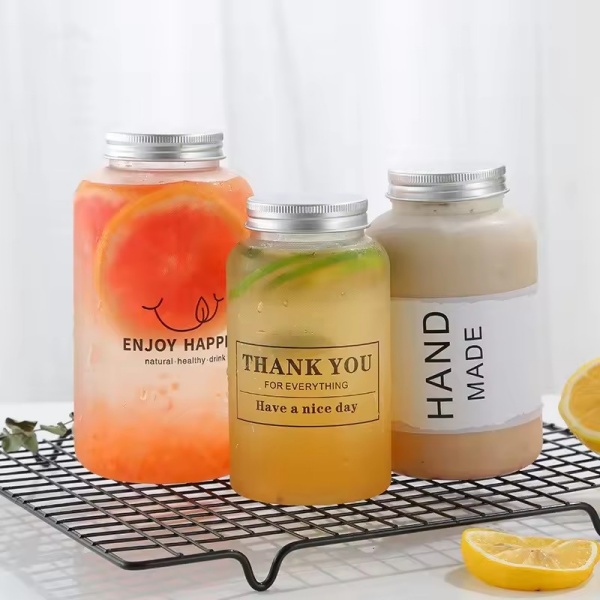
From our China-based facility, I offer PET Cylinder Bottles that meet the daily needs of cosmetic, pharma and hygiene brands. As a direct Manufacturer, I know B2B buyers want reliability, clear glass-like clarity, and strong sealing at a fair price. Our PET Cylinder Bottles are lightweight yet sturdy, with uniform wall thickness, smooth threads, and compatibility with standard caps. I can tailor volumes, neck finishes, color options, and labeling to fit your line. Fast lead times, scalable production, and strict QC mean fewer QA hurdles for your distributor network. You’ll get competitive pricing, flexible MOQs, and traceable quality from raw material to finished bottle. Based in China, I coordinate logistics to minimize risk and shorten timelines. If you need child-resistant or airtight closures, I arrange it. I’m ready to partner with you to protect your product integrity while maximizing shelf appeal.

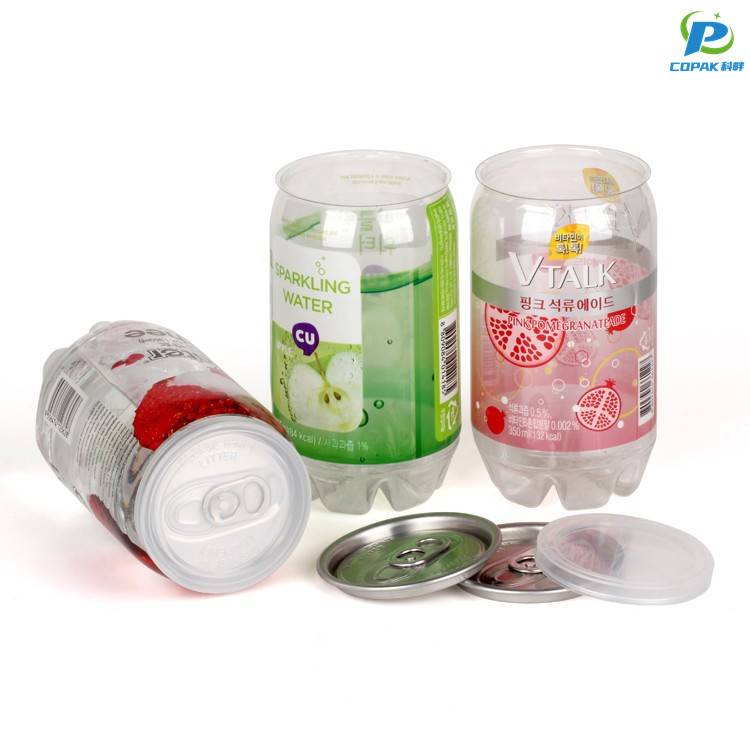
PET Cylinder Bottles in 2025 Ahead of the Curve
As PET cylinder bottles step into 2025, global buyers are prioritizing a blend of sustainability, performance and cost-efficiency. Expect widespread adoption of mono-material and rPET solutions that simplify recycling without compromising clarity or strength, plus advanced barrier options for longer shelf life and food safety compliance. Lightweighting, customizable neck finishes and premium decoration techniques make cylindrical PET ideal for personal care, beverages and pharmaceuticals while meeting evolving EU and FDA requirements. To stay ahead, source partners who can offer scalable production, proven quality systems and transparent supply chains—fast sample turnarounds, flexible MOQs, and reliable global logistics are essential. Prioritizing suppliers that combine certified materials, technical support for design and barrier optimization, and competitive lead times will ensure your product launches in 2025 are both sustainable and commercially successful.
| Metric | Unit | 2022 (typical/observed) | 2025 (projected / estimated) | Notes |
|---|---|---|---|---|
| Global PET bottle production (by mass) | million tonnes | ~25.0 | ~27.5 | Estimate based on industry production trends (3–4% CAGR). |
| Average empty weight — 500 mL cylinder PET bottle | g / bottle | 11–13 | 10–12 | Lightweighting continues; range reflects design & barrier options. |
| Common capacity share (by units) — 250 / 500 / 1,000 / other | % | 15 / 45 / 25 / 15 | 14 / 47 / 24 / 15 | Modest shift toward single-serve (500 mL). |
| PET density (polyethylene terephthalate) | g·cm⁻³ | ~1.38 | ~1.38 | Intrinsic material property; consistent across years. |
| Glass transition temperature (Tg) | °C | ~70–80 | ~70–80 | Depends on crystallinity and additives. |
| Melt temperature (typical processing range) | °C | ~250–260 | ~250–260 | Blow-molding and extrusion conditions. |
| Tensile strength (orientation-dependent) | MPa | ~55–75 | ~55–75 | Variation by grade & orientation during processing. |
| rPET share in PET beverage bottles (by mass) | % | 20–30 | 25–40 | Projected rise due to higher collection & regulatory targets. |
| Bottle-to-bottle (closed-loop) recycling yield | % | 60–75 | 65–80 | Improvements from sorting, decontamination & PCR cleaning. |
| Typical cradle-to-gate carbon footprint (virgin PET) | kg CO2e / kg PET | ~2.2 | ~1.8–2.0 | Projected reduction as rPET use increases and energy mixes decarbonize. |
| Barrier / multi-layer cylinder bottles (adoption) | % of unit volume | 20–30 | 25–35 | Barrier coatings for gas/odor protection grow in beverage & liquid food segments. |
| Typical post-consumer PET collection rate (major regions average) | % | ~40 (global avg) | ~45 (global avg) | Regional variance high: some regions >60%, others <30%. |
| Design for recycling (mono-PET, removable labels) | Adoption level | Increasing (practice) | Widespread best-practice (expected) | Design-for-recycling guidelines increasingly applied to cylinder bottles. |
| Typical shelf life improvements with barrier & processing | months | 6–12 | 6–14 | Depends on product and barrier technology; modest extension expected. |
| Regulatory / policy drivers affecting bottle design | Examples | Recycled content targets, collection mandates | Higher recycled content targets; extended producer responsibility (EPR) | Policy timelines accelerate rPET demand and collection infrastructure. |
| Key performance trade-offs (lightweighting vs. recyclability) | Summary | Thinner walls reduce material use but can complicate recycling & barrier performance | Optimized designs balance weight, barrier, and rPET content | Design choices guided by lifecycle assessments and recycling infrastructure. |
Related Products
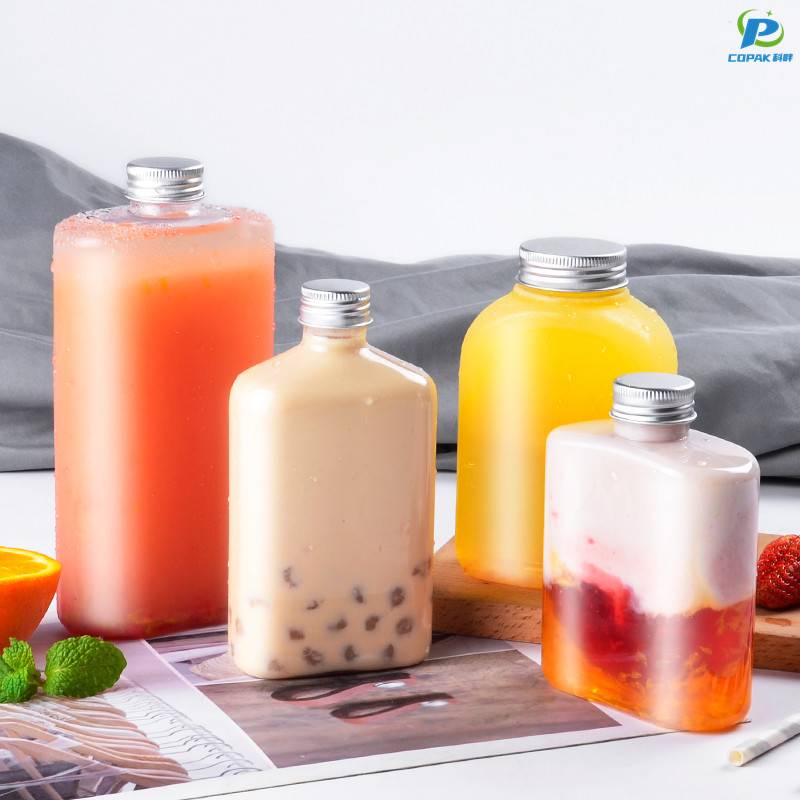
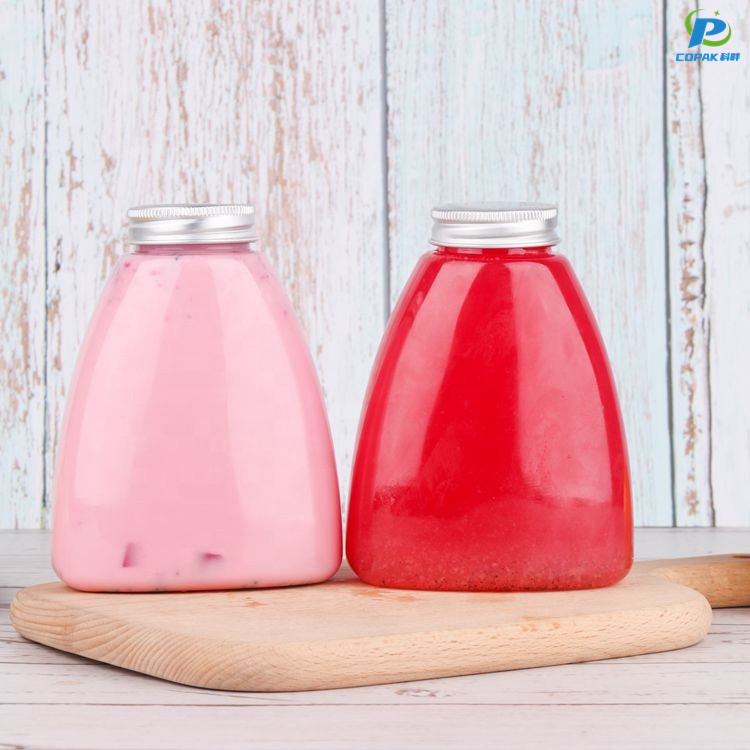
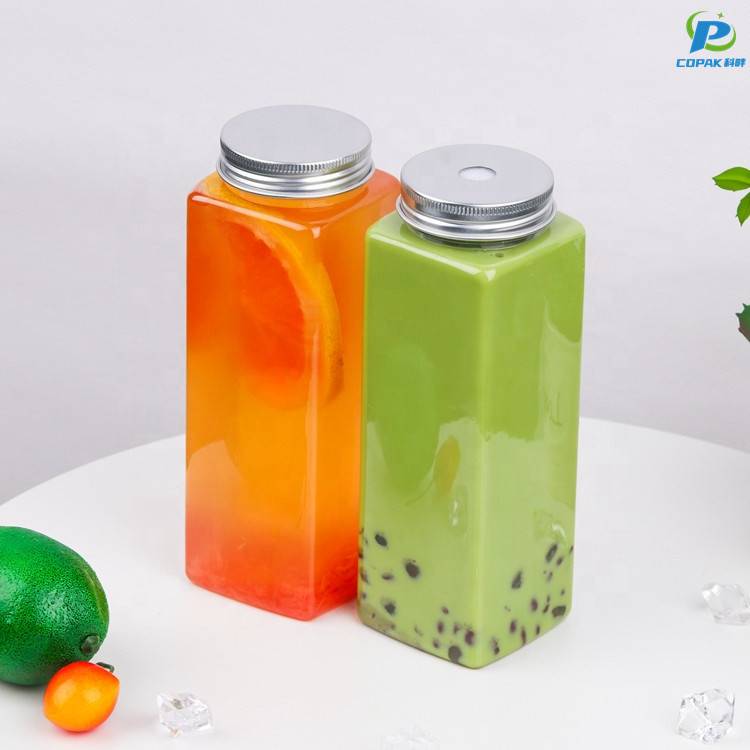

PET Cylinder Bottles Is The Best Factory-Direct Excellence
Top Selling Products




- Related Blog
- Reviews
- Reviews
