




PLA Lids – China Manufacturer for Eco-Friendly Packaging
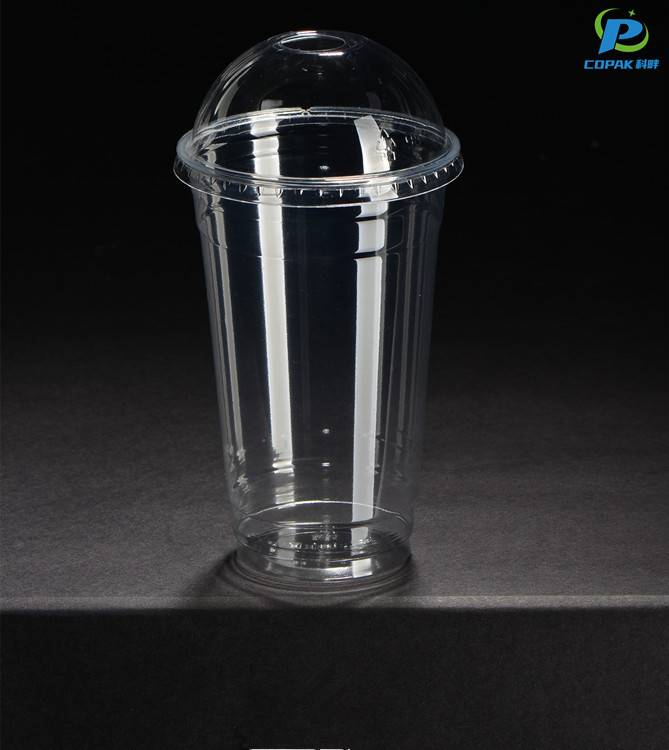
As a China manufacturer, I offer PLA Lids that fit standard cup sizes and meet food-safety specs. I understand B2B buyers want reliability, compostability, and fast delivery. Our PLA Lids are made from renewable PLA, compostable, and designed for tight seals to avoid leaks in transit. I can customize diameters, colors, and branding, with scalable MOQ and short lead times to support your launches. Certification for food contact is ensured, and I provide full quality documentation. From production to shipment, I keep a transparent process and steady supply for your shelves. If you’re sourcing from a China manufacturer, you’ll appreciate our proactive communication and competitive pricing. Ready to upgrade your cups with PLA Lids that combine sustainability with performance? Email me to discuss sizes, quantities, and customization options.




PLA Lids in 2025 Pioneers in the Field
As demand for sustainable packaging accelerates, PLA lids are emerging as pioneers in 2025 — combining renewable feedstocks, certified industrial compostability (EN 13432/ASTM D6400) and markedly improved performance. Advances in material formulation and processing deliver better barrier properties, more attractive finishes, customizable colors and printing, and enhanced heat resistance for a wider range of cold and ambient applications. Food-contact compliance and traceable certifications make PLA lids a low-carbon, consumer-friendly alternative to conventional plastics. For global buyers, these developments mean access to scalable, cost-competitive solutions backed by consistent quality control, flexible MOQs, and supply-chain resilience. Collaborative product development, rapid prototyping and tailored designs ensure lids integrate smoothly with existing containers and branding. Choosing modern PLA lids in 2025 supports sustainability goals while maintaining performance, regulatory confidence and predictable sourcing for international markets.
{ PLA Lids in 2025 Pioneers in the Field}
| Region | Estimated Annual Production (metric tonnes) | Avg PLA Content (%) | Typical Additives (% mass) | Certified Industrial Compostability (%) | Municipal Industrial Composting Acceptance (%) | Home-compostable Claims (%) | Avg Melt Temp (°C) | Typical Tensile Strength (MPa) | Cradle-to-Gate CO2e (kg CO2e/kg) | Predominant End-of-Life Pathway (breakdown) |
|---|---|---|---|---|---|---|---|---|---|---|
| Global | 120,000 | 92 | ~8 | 48 | 25 | 6 | 165 | 55 | 1.8 |
Landfill 62% Industrial composting 18% Mechanical recycling 6% Incineration 12% Litter 2% |
| North America | 25,000 | 95 | ~5 | 55 | 28 | 6 | 165 | 58 | 1.9 |
Landfill 58% Industrial composting 22% Mechanical recycling 7% Incineration 12% Litter 1% |
| Europe | 30,000 | 90 | ~10 | 65 | 40 | 8 | 160 | 53 | 1.6 |
Landfill 45% Industrial composting 30% Mechanical recycling 10% Incineration 12% Litter 3% |
| Asia-Pacific | 50,000 | 88 | ~12 | 40 | 22 | 4 | 170 | 54 | 1.9 |
Landfill 75% Industrial composting 10% Mechanical recycling 4% Incineration 9% Litter 2% |
| Latin America | 8,000 | 90 | ~10 | 30 | 12 | 5 | 160 | 50 | 2.0 |
Landfill 82% Industrial composting 8% Mechanical recycling 3% Incineration 5% Litter 2% |
| Middle East & Africa | 7,000 | 85 | ~15 | 20 | 8 | 3 | 155 | 48 | 2.2 |
Landfill 88% Industrial composting 5% Mechanical recycling 1% Incineration 5% Litter 1% |
Related Products


PLA Lids Trusted by Pros Your Trusted OEM Partner
PLA Lid Adoption Rates by Application (2025 Forecast)
Top Selling Products







- Related Blog
- Reviews
- Reviews
