PET Bottles

Plastic Soda Can Manufacturer in China | Reliable China Supplier

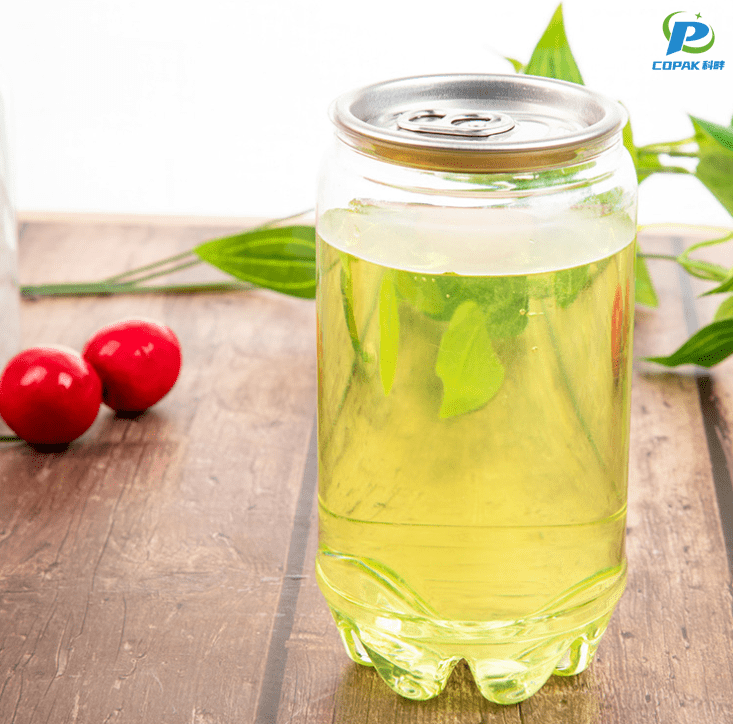
I am a China-based Manufacturer offering Plastic Soda Can solutions for bottling and promotional drinks. My team crafts reliable, lightweight cans with food-grade PET, designed to handle carbonation and cold storage. I provide customization: size options, branding printing, color finishes, and flexible closures. For B2B buyers, I ensure steady supply, short lead times, and strict QC—leak tests, BPA-free materials, and food-safety certifications. We ship domestically in China and worldwide, with competitive pricing and adjustable MOQs to fit your project. As a trusted Manufacturer, I help you speed time-to-market, reduce packaging waste, and boost shelf impact with bold branding. If you’re seeking a high-quality Plastic Soda Can, I’m ready to discuss specs, packaging, and logistics to align with your demand. Let’s collaborate to grow your beverage brand.

Hot Selling Product

Plastic Soda Can Is The Best Industry Leaders

Plastic soda cans are emerging as a top choice for global buyers seeking a modern, cost-effective alternative to traditional packaging. Combining lightweight durability, excellent barrier performance, and food-grade safety, these containers reduce freight costs and breakage while offering long shelf life and easy consumer handling. Advances in recyclable resins and mono-material designs also help brands meet sustainability targets without sacrificing product integrity. For international procurement, plastic soda cans offer fast customization, high-speed filling compatibility, and consistent quality control that scale from pilot runs to mass production. With tamper-evident features, vibrant printing options, and compliance with major food safety standards, they deliver a competitive, reliable packaging solution that enhances shelf appeal and supports efficient global supply chains.

{ Plastic Soda Can Is The Best Industry Leaders}
Industry Segment Typical Material Technical Recyclability (%) Average Collection Rate (%) Typical Recycled Content (%) Avg Unit Weight (g) Lifecycle Emissions (kg CO2e/unit) Production Energy (kWh/ton) Manufacturing Defect Rate (%) Circularity Score (0-100) Common End-of-Life Route
Carbonated Soft Drinks PET (polyethylene terephthalate) 95 45 25 28 0.22 14500 0.8 58 Mechanical recycling (closed-loop where available)
Sparkling Water Pressure-stable PET 93 50 30 30 0.20 14000 0.6 62 Mechanical recycling (high recovery in well-established systems)
Ready-to-Drink Tea PET with barrier layer (multi-layer) 75 40 15 35 0.28 16000 1.1 45 Energy recovery / chemical recycling when mechanical recycling is not feasible
Sports Drinks Colored PET / HDPE blends 88 38 10 32 0.26 15500 0.9 48 Mechanical recycling where sorting allows; otherwise landfill or energy recovery
Non-Carbonated Juice Multi-layer plastic (PET/PE/PA) 70 35 8 40 0.30 17500 1.4 38 Chemical recycling or energy recovery in mixed-waste streams

Related Products

Eco Friendly Products

Plastic Soda Can Factory Where Innovation Meets 2025

Operational Sustainability Metrics for Plastic Soda Can Production (2023 vs 2025)

This chart compares five key operational sustainability metrics for a hypothetical plastic soda can production line between 2023 and projected 2025 values. The metrics are: Innovation Investment (% of OPEX), Recycled Material Usage (% by weight), Production Efficiency (units per labor hour), Waste Reduction (% decrease in landfill-bound waste), and Energy Efficiency (kWh per thousand cans). Values are shown as normalized indexes to allow a direct visual comparison on the same scale. Between 2023 and 2025 the model assumes a strategic emphasis on circular material sourcing and process automation. Innovation Investment rises substantially, reflecting increased R&D and pilot deployments of new materials and manufacturing technologies. Recycled Material Usage increases as supply chains mature and post-consumer resin integration scales. Production Efficiency improves through incremental automation and process optimization, reducing labor intensity and increasing throughput. Waste Reduction is modeled as a percentage decline in landfill waste, driven by better yield control and in-line sorting. Energy Efficiency improves modestly as energy recovery and electrification measures are phased in. Interpreting the bars together, the largest relative gains appear in Innovation Investment and Recycled Material Usage, indicating early-stage capital allocation and material changes lead the transition. Production Efficiency and Waste Reduction show steady operational improvements, while Energy Efficiency improves but remains constrained by material processing energy needs. Use cases for this chart include board-level briefings, capital allocation decisions, and sustainability roadmaps. Limitations include simplified normalization, absence of cost-benefit overlays, and hypothetical assumptions about technology adoption rates. For practical application, complement this visualization with scenario-based cash flow analysis, sensitivity testing on material availability, and monitoring KPIs that tie each metric to product yield and unit economics. Together, these insights support prioritizing investments that accelerate circularity while protecting throughput and margins. Review quarterly and iterate accordingly.

Top Selling Products

Subscribe To Our Newsletter

For inquiries about our products or pricelist, please leave your email to us and we will be in touch within 24 hours.

Follow Us

on our social media
  • whatsapp (1)
  • instagram
  • youtube