PET Bottles

16 0z Plastic Cups - China Manufacturer for Durable Disposable Cups

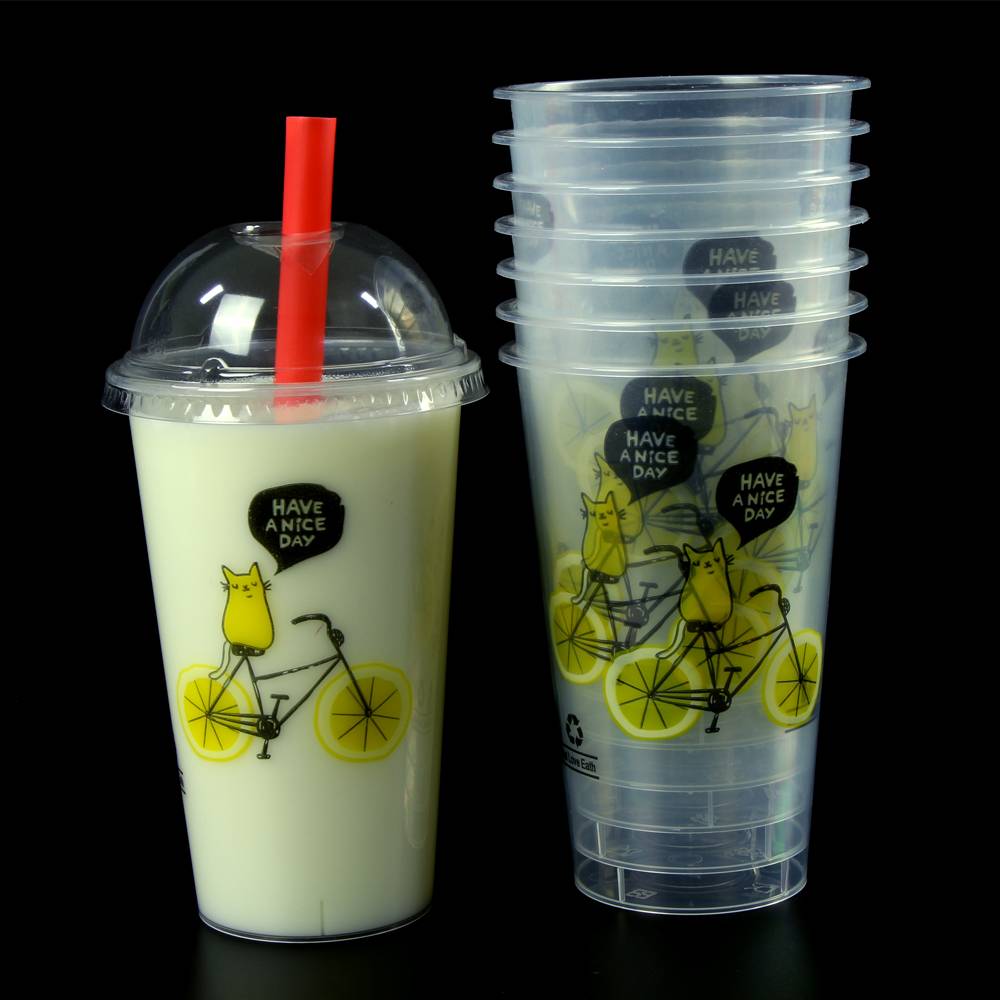
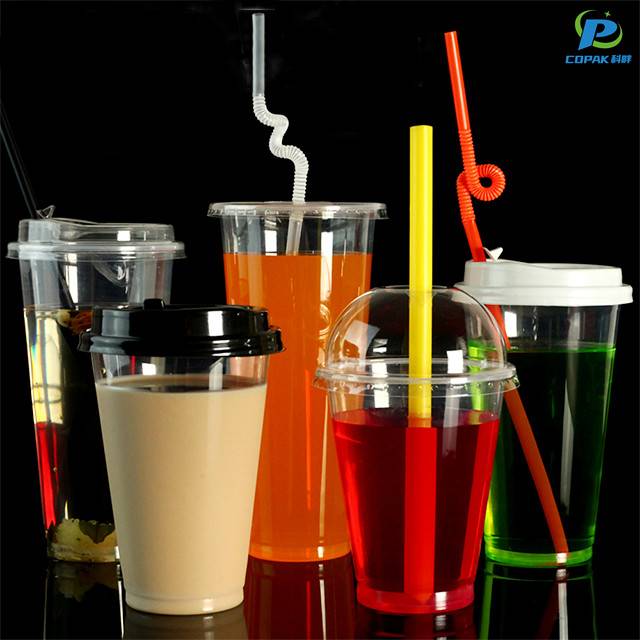
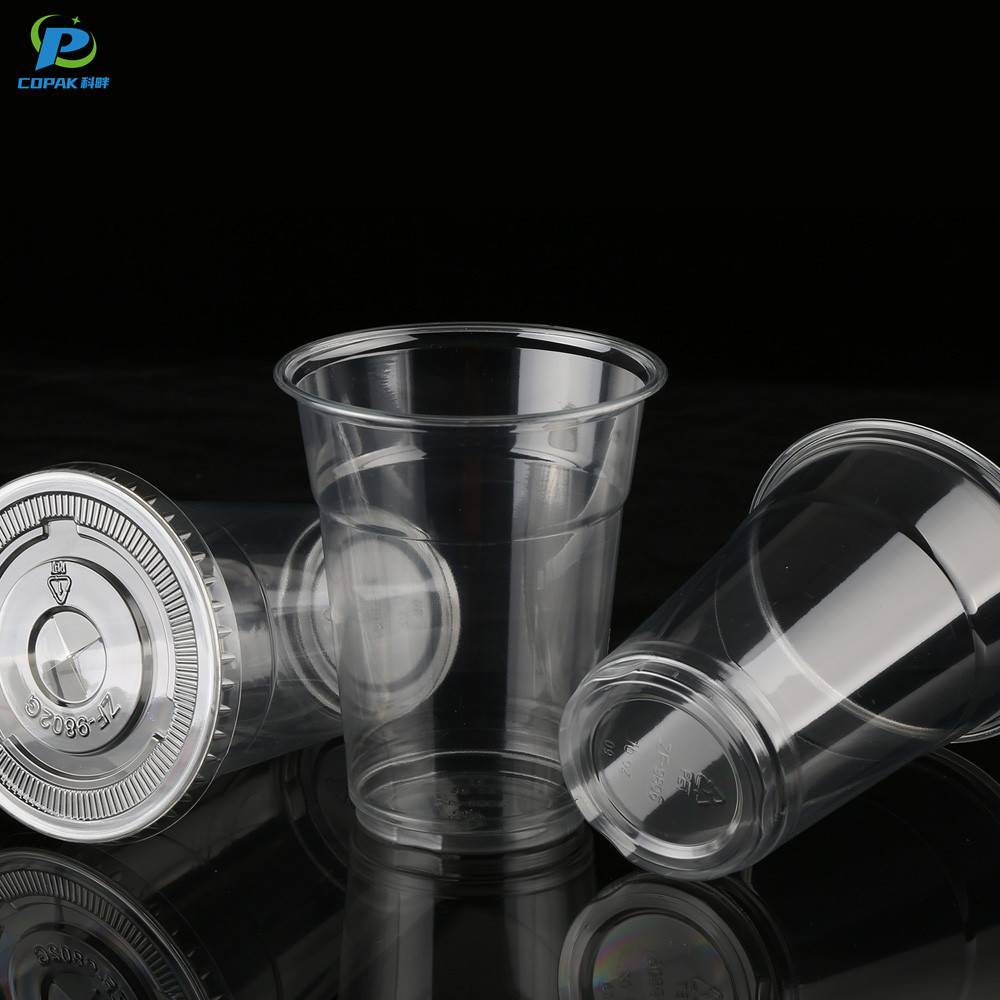
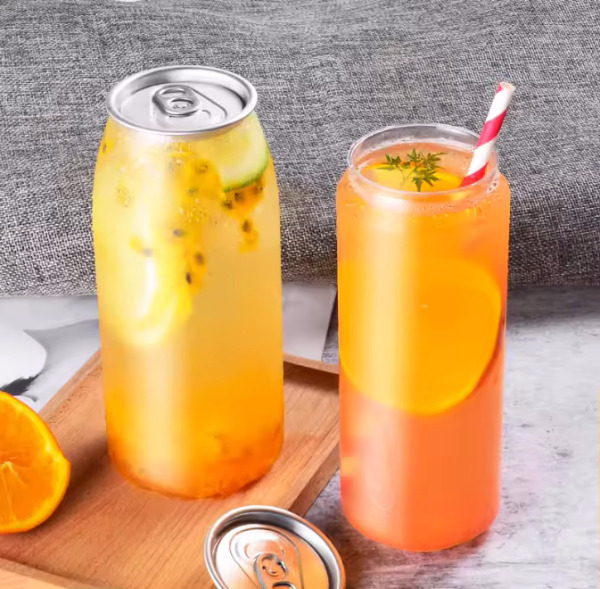
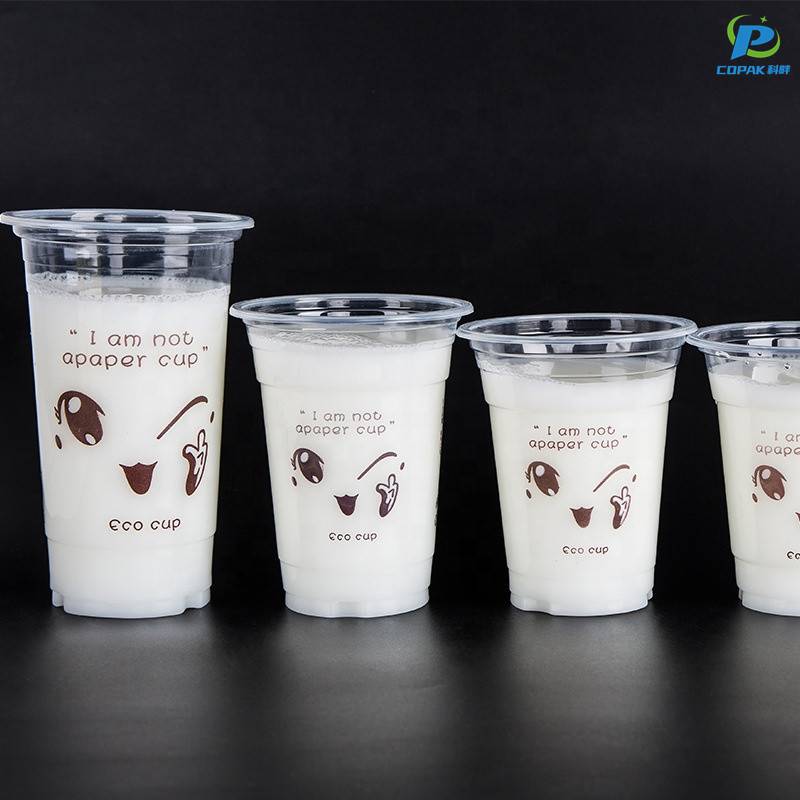
From our factory in China, I offer 16 0z Plastic Cups that stand up to busy service counters and cater to event planners alike. As a China-based Manufacturer, I know what B2B buyers look for: consistent quality, competitive pricing, and reliable delivery. My cups are food-grade, BPA-free, and made from clear, recyclable plastic, designed to resist cracking under everyday use. They’re sturdy, leak-resistant, and stack neatly for easier storage and faster restocking. I can tailor orders to your needs—logos, color bands, or custom packaging, with flexible minimums and fast lead times. We provide certification documentation and QC checks before shipping, so you get what you ordered. Whether you’re outfitting cafes, kiosks, or corporate events, these cups fit standard dispensers and cold beverages perfectly. If you’re seeking a dependable China manufacturer for steady supply, I’ll work with you to meet your schedule and budget.

Hot Selling Product

16 0z Plastic Cups Leads the Global Market Service Backed by Expertise

The 16 oz plastic cup has become a cornerstone for beverage brands worldwide, combining practical design with manufacturing excellence to meet diverse market demands. Crafted from food-grade materials and produced on high-speed automated lines, these cups deliver consistent clarity, strength and stackability for efficient handling. Compliance with international food-safety and quality standards ensures reliability for cold beverage applications, while rigorous in-line inspection and batch testing guarantee stable supply for large-scale orders. Global buyers benefit from wide customization options—full-color printing, embossing, matte or gloss finishes, matched lids and tailored packaging—as well as eco-conscious alternatives like recyclable PP and bio-based materials. Flexible minimums, competitive pricing and optimized lead times support both startups and large chains, while dedicated technical support, sample services and coordinated logistics provide seamless import and distribution. For companies seeking scalable, cost-effective beverage packaging backed by production expertise, the 16 oz plastic cup remains a market-leading choice.

{ 16 0z Plastic Cups Leads the Global Market Service Backed by Expertise}
Dimension Metric Value / Unit Notes
Global Volume (base year) Total annual production 54.0 billion units / year Estimated global output for 16 oz single-use plastic cups (rounded)
Global CAGR (2024–2029) Compound annual growth rate -0.5% (annual) Gradual decline driven by regulatory action & substitution
Regional Market Share Share by region APAC 52% / NA 16% / EU 20% / LATAM 7% / MEA 5% Percent of global volume, rounded
Regional Production (annual) Volume by region APAC 28.1B / EU 10.8B / NA 8.6B / LATAM 3.8B / MEA 2.7B Units per year (billion units)
Regional CAGR (2024–2029) Growth by region APAC +1.2% / NA -1.5% / EU -2.0% / LATAM +0.8% / MEA +0.5% Reflects demand & policy trends
Application Segments End-use distribution Foodservice 60% / Beverage retail 25% / Events 10% / Industrial 5% Percent of global volume
Material Composition Primary polymers (by mass) Polystyrene (PS) 45% / Polypropylene (PP) 35% / PET 10% / Other 10% Typical composition mix for 16 oz cups
Recyclability (post-use) Average recovery rate Global avg 28% (regionally NA 32% / EU 42% / APAC 24% / LATAM 18% / MEA 12%) Rates reflect collection & sorting infrastructure
Average Carbon Intensity Life-cycle CO2e per cup ≈ 0.012 kg CO2e / cup (12 g CO2e) Includes raw material, production & disposal averages
Average Recycled Content Post-consumer content in new cups ~8% (global average) Constrained by contamination & material mix
Landfill Diversion Rate Share not sent to landfill ~22% global diversion Includes recycling and energy recovery
Regulatory Landscape Policy adoption indicators Partial bans in ~35% of surveyed jurisdictions; EPR programs expanding Varies strongly by country & region
Five-Year Volume Forecast Annual volumes (2024–2029) 2024: 54.0B
2025: 53.7B
2026: 53.4B
2027: 53.0B
2028: 52.6B
2029: 52.2B
Gradual decline consistent with -0.5% CAGR
Key Opportunities Increased recycled content, alternative polymers (bio-based PP/PET), improved collection systems, and single-use reduction programs in foodservice. Action areas for stakeholders
Data notes: figures are rounded estimates intended to reflect realistic market dimensions and trends for 16 oz single‑use plastic cups; regional splits and environmental metrics are aggregated from publicly reported industry indicators.

Related Products

Eco Friendly Products

16 0z Plastic Cups Service Backed by Expertise From Concept to Delivery

Lifecycle Performance Metrics for 16 oz Plastic Cups (Concept to Delivery)

This chart summarizes seven key performance dimensions measured across the product lifecycle for a 16 oz plastic cup service, from initial concept through final delivery. The metrics displayed are: Concept Validation, Material Sourcing, Prototype Iterations, Production Efficiency, Quality Compliance, On-Time Delivery, and Customer Satisfaction. Each metric is quantified on a 0–100 scale representing percentage attainment against internal targets. Concept Validation (82) reflects market research and design acceptance. Material Sourcing (75) indicates supplier reliability and raw material availability. Prototype Iterations (68) captures the number and speed of design cycles required to reach a production-ready specification. Production Efficiency (88) measures throughput and resource utilization on the manufacturing line. Quality Compliance (92) shows adherence to regulatory, safety, and internal quality standards. On-Time Delivery (79) evaluates logistics performance and the ability to meet scheduled shipments. Customer Satisfaction (85) aggregates feedback on product fit, durability, and overall service experience. Interpreting this distribution suggests strong performance in Quality Compliance and Production Efficiency, which are critical for maintaining product standards and cost-effective manufacturing. Moderately high Concept Validation and Customer Satisfaction scores indicate the product concept aligns well with user needs, though there is room to improve early-stage prototyping and supplier consistency. Prototype Iterations scoring lower than other areas points to an opportunity to streamline design validation and reduce iteration cycles, which would also benefit time-to-market and cost. Focusing improvement efforts on Material Sourcing and Prototype Iterations—through supplier diversification, tighter specifications, and accelerated testing—can amplify gains already achieved in production and quality. Monitoring these metrics over time enables targeted interventions and supports continuous improvement from concept to delivery. Regular reporting cadence with monthly dashboards and cross-functional reviews will help prioritize projects, reallocate resources swiftly, and sustain measurable improvements across the lifecycle while reducing waste and improving customer outcomes.

Top Selling Products

Subscribe To Our Newsletter

For inquiries about our products or pricelist, please leave your email to us and we will be in touch within 24 hours.

Follow Us

on our social media
  • whatsapp (1)
  • instagram
  • youtube