




Biodegradable Drinking Cups - China Manufacturer
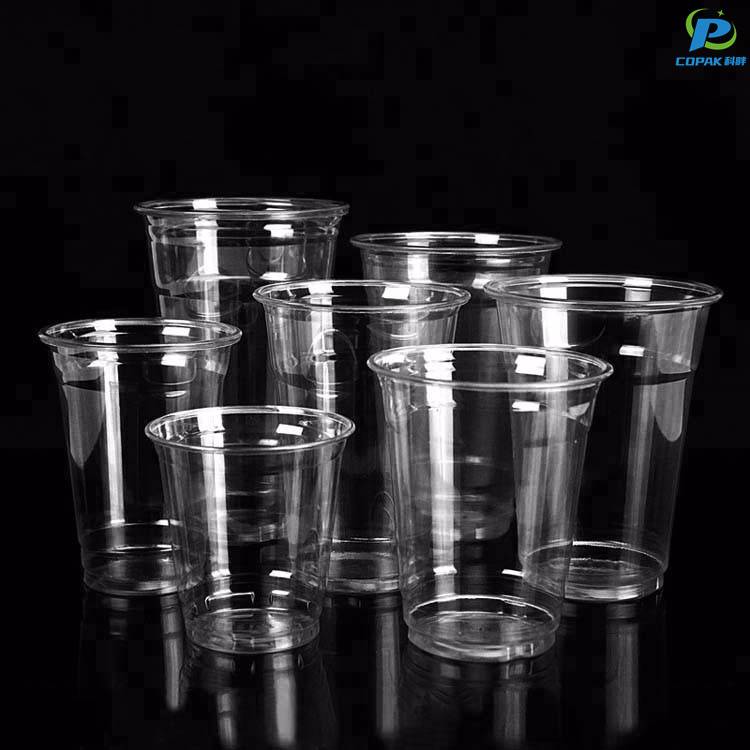
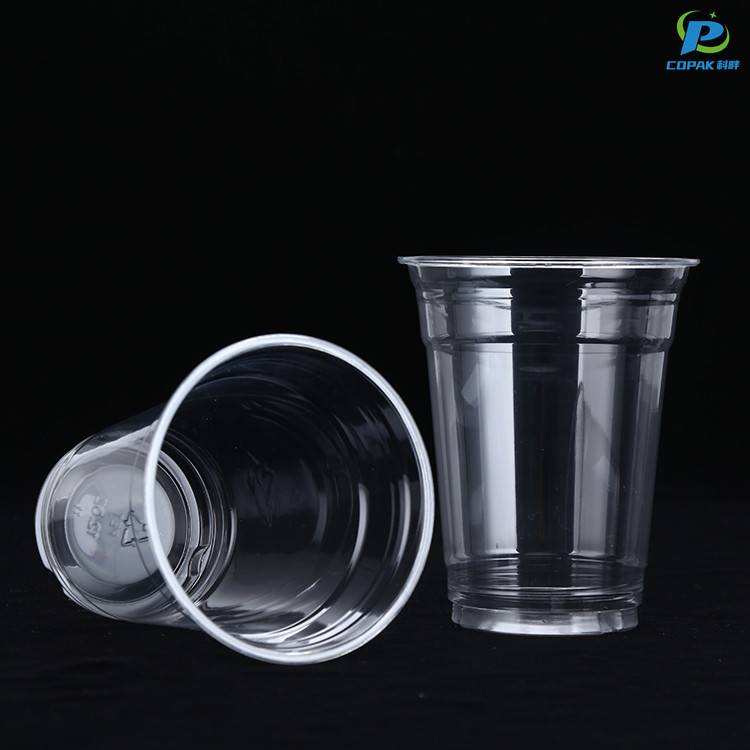
China-based Manufacturer here, I offer Biodegradable Drinking Cups designed for cafes, events, and distributors who want to cut plastic waste. I supply these cups to B2B buyers with a focus on reliability and sustainability. Made from plant-based materials, they are compostable in industrial facilities within 60–90 days, BPA-free, and safe for hot or cold drinks. Each cup features a leak-resistant seam and can be ordered in multiple sizes with either a matte or gloss finish. Custom logo printing and packaging are available to help your brand stand out. By choosing our Biodegradable Drinking Cups, you support a circular economy while meeting growing consumer demand for responsible packaging. I offer competitive pricing, flexible MOQs, and steady supply from our China manufacturing network. Whether you're a retailer, distributor, or food-service chain, I’m ready to partner with you and streamline your procurement of sustainable cups.


Biodegradable Drinking Cups in 2025 Industry Giant
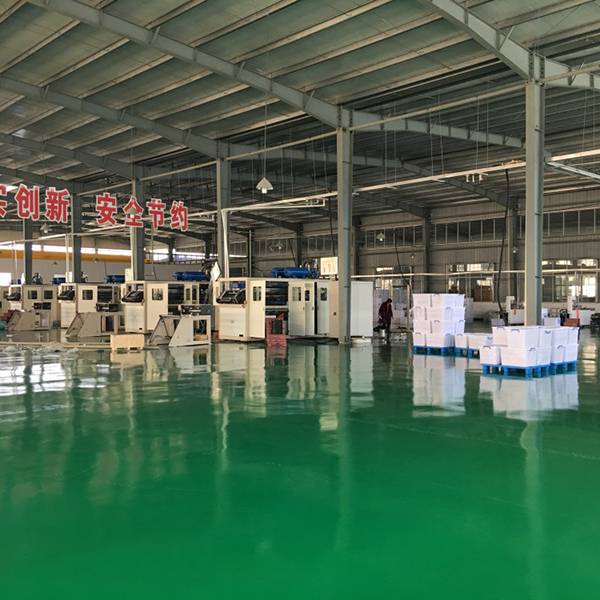
The push for single-use plastic alternatives has reached a tipping point in 2025, and biodegradable drinking cups are now central to global procurement strategies. Modern options—PLA, PBAT blends, molded fiber (bagasse) and sustainably lined paper—offer full compostability, food-contact safety and printable surfaces for brand differentiation. Buyers prioritize certified solutions (EN 13432, ASTM D6400, OK Compost, FDA), consistent quality, and measurable lifecycle benefits to meet regulations and consumer demand across markets. As an industry giant based in Shanghai with integrated R&D and production lines, we deliver large-scale, customizable output with strict QC, competitive pricing and flexible MOQs. OEM/ODM services, sustainable packaging and proven export logistics ensure faster lead times and reliable seasonal supply. Global purchasers seeking compliant, scalable biodegradable cup solutions will find the manufacturing capacity and technical support necessary to transition quickly and confidently.
| Material Type | Compliance Standards | Industrial Composting Time (weeks) | Home Compostable | CO2e Footprint (kg CO2e/kg) | Recyclability in Municipal Stream | Primary Use Cases | Projected Market Share 2025 (%) |
|---|---|---|---|---|---|---|---|
| PLA (polylactic acid) | EN 13432; ASTM D6400 (industrial) | 6–12 | No (requires industrial) | ~1.8 | No (not accepted in standard paper stream) | Cold drinks, smoothies, clear cup applications | 20% |
| Paper with water‑based barrier | EN 13432; national compost labels (where tested) | 8–12 | Conditional (depends on coating) | ~1.6 | Often No (coating can disrupt paper recycling) | Hot beverages, takeaway cups, mainstream coffee cups | 35% |
| Bagasse (sugarcane fiber) | EN 13432; EN 14995 (biodegradable plastics where applicable) | 4–8 | Yes (often home & industrial) | ~0.5 | Yes (fibrous; accepted in organics/compost) | Hot & cold food/drink, disposables for events | 25% |
| Starch‑based (modified starch blends) | ASTM D6400; EN 13432 (formulation dependent) | 4–12 | Conditional (some formulations OK) | ~1.1 | Depends (may contaminate paper stream) | Short‑life cold/hot beverages, lids, cups for events | 12% |
| PHA (polyhydroxyalkanoates) | EN 13432; ASTM D6400; OK compost industrial | 4–8 | Yes (many formulations) | ~3.2 | No (not typical in paper stream; specialized recycling) | Premium compostable cups for hot & cold use | 8% |
Related Products


Biodegradable Drinking Cups Trusted by Pros Exceeds Industry Benchmarks
Top Selling Products





- Related Blog
- Reviews
- Reviews
