




Biodegradable Ice Cream Cups - China Manufacturer for Eco Customers
From the heart of China, I represent a dedicated Manufacturer offering Biodegradable Ice Cream Cups designed for cafes, chains, and event caterers. Our cups are compostable, sturdy, and grease-resistant, keeping cold desserts intact without compromising the environment. I tailor orders to your volume—from small trials to large rollouts—with fast production, consistent color, and reliable packaging. We use food-grade coatings that resist condensation and leakage, so your service stays clean. We can supply standard sizes or customize printing and logos to boost your brand. You’ll appreciate clear conformity to global standards and sustainable sourcing that appeals to eco-conscious customers. If you're sourcing in China, I can provide samples, competitive pricing, and flexible lead times. My goal is to become your trusted partner—biodegradable, affordable, and ready to ship as your demand grows.
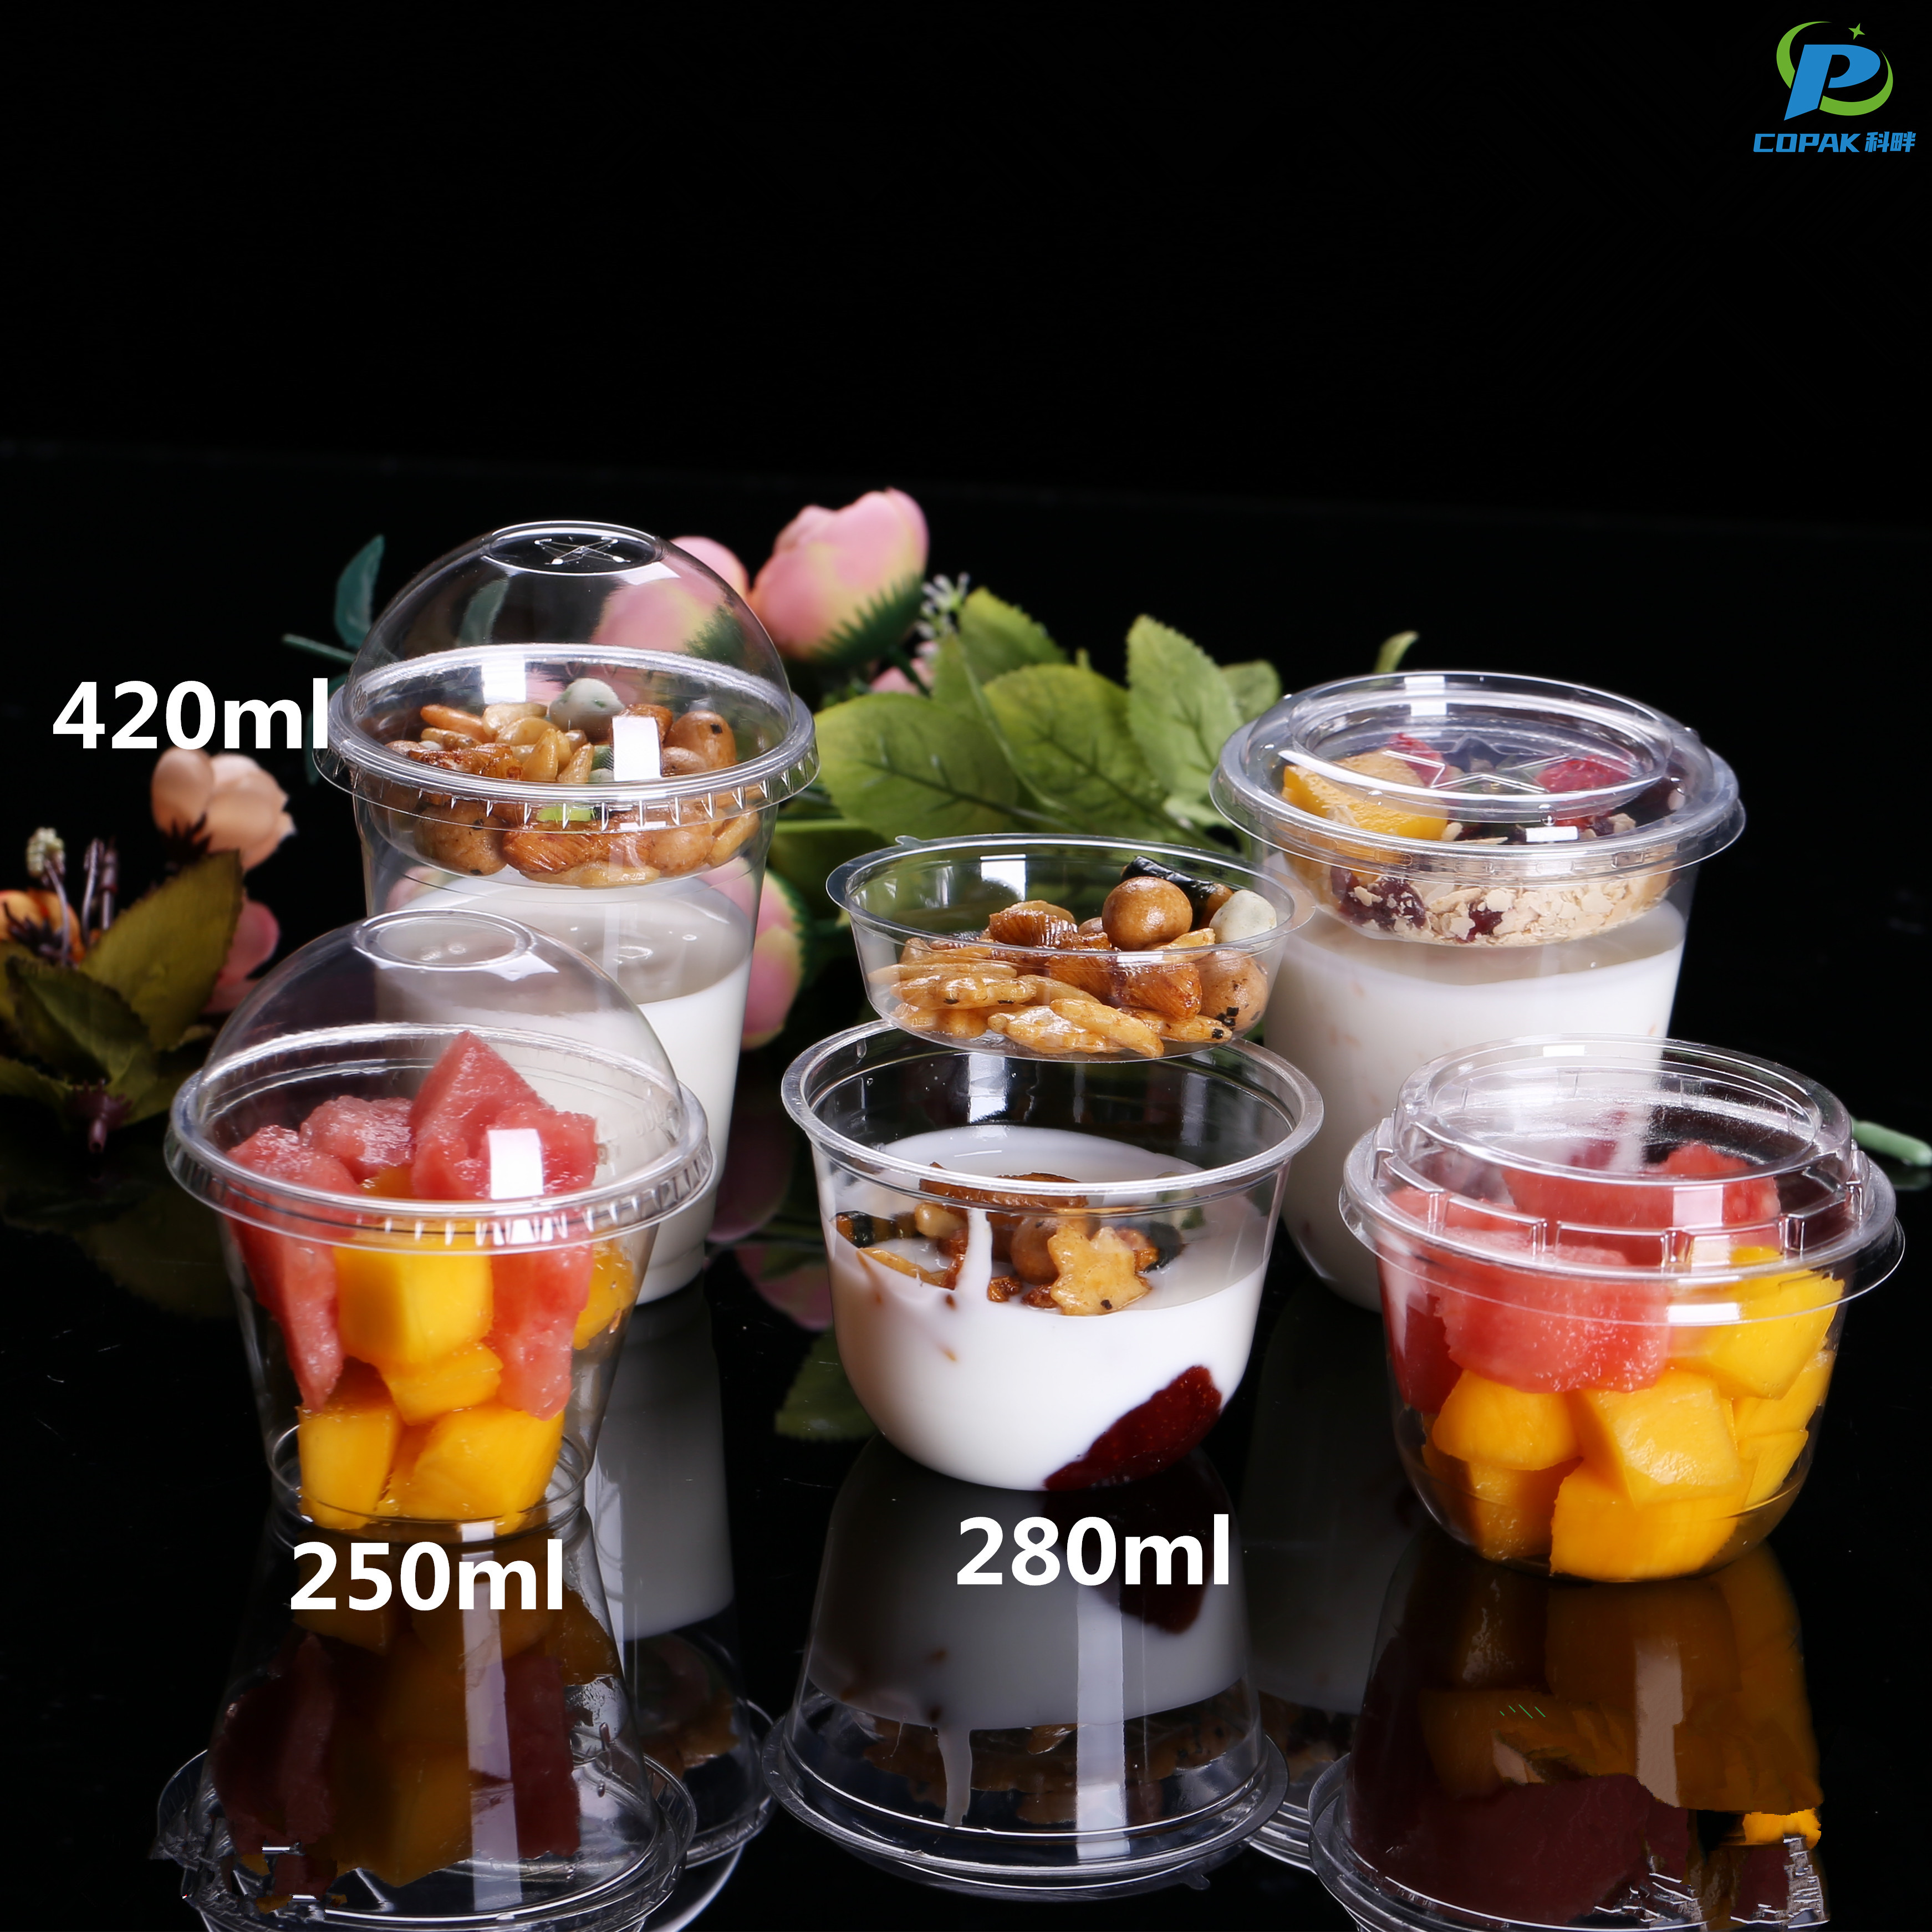


Biodegradable Ice Cream Cups Where Service Meets Innovation Service Backed by Expertise
Biodegradable ice cream cups where service meets innovation — next-generation compostable cups engineered from plant-based polymers and molded fiber to deliver sturdy, leak-resistant vessels that perform under cold and creamy conditions while meeting international compostability standards (e.g., EN13432, ASTM D6400). Designed for frozen desserts, they resist grease and condensation, offer excellent printability, and can be tailored in size, wall thickness, and surface finish to elevate brand presentation without compromising sustainability. Service backed by expertise — end-to-end sourcing support from material selection and prototyping to certified mass production, rigorous QC, and dependable global logistics. Flexible MOQs, competitive pricing, fast sampling, OEM/ODM capabilities, and responsive after-sales technical support make it easy for distributors, retailers, and foodservice operators to transition to eco-friendly packaging. Partnering with an experienced supplier reduces environmental impact, controls costs, and accelerates time-to-market.
| Attribute | Specification | Standard / Test | Notes |
|---|---|---|---|
| Material Composition | Typical: 85% bagasse (sugarcane fiber) + 15% water-based barrier (PLA or starch-based coating) | Gravimetric / FTIR analysis | Barrier formulation varies; affects compostability and grease resistance |
| Available Capacities | 120 ml (4 oz); 180 ml (6 oz); 250 ml (8.5 oz) | Volumetric fill measurement | Common single-serve sizes for cups and sundae portions |
| Wall Thickness | 0.6 – 1.0 mm (typical) | Caliper / micrometer | Balance between stiffness and compostability; thicker walls increase durability |
| Thermal Tolerance | Operational: −30°C to +70°C (short-term exposure up to ~90°C) | Thermal cycling test | Suitable for frozen desserts; avoid prolonged contact with boiling liquids |
| Freezer Stability | Stable at −30°C for extended storage; no cracking after 24–72 h | Freeze-thaw and visual inspection | Maintains shape and insulation in commercial freezers |
| Leakage Resistance | No leakage in 10-minute static water test when filled to rim | 10-minute static water / seam integrity test | Quality control benchmark for seam and coating performance |
| Insulation Performance | Typical temperature rise of 3–5°C over 10 minutes for 120 ml at 22°C ambient | Thermal descent lab test | Performance varies with wall thickness, color, and lid use |
| Industrial Composting Time | ~6–12 weeks (56–84 days) to disintegration under industrial conditions | ASTM D5338 / EN 13432 protocols | Requires thermophilic composting (controlled temperature & aeration) |
| Home Composting Estimate | ~6–18 months; PLA-lined variants may not fully degrade in typical home piles | Home-compost trials (variable) | Industrial composting recommended for predictable breakdown |
| Certifications | Typically compatible with EN 13432, ASTM D6400, ISO 17088 testing (dependent on final formulation) | Certification test suites | Certification issued after batch-specific testing |
| Food Contact Compliance | Meets common international food-contact requirements when tested (migration and safety) | Food-contact migration and compositional tests | Final compliance depends on exact material formulation and tests |
| Typical Carbon Footprint | Estimated 15–35 g CO2e per cup (cradle-to-gate), varies by material source and capacity | Midpoint LCA estimate | Lower than many fossil-based alternatives when feedstock is byproduct biomass |
| Disposal Recommendation | Industrial composting / municipal organics collection preferred; avoid standard paper recycling if coated | Municipal waste guidance | Clear on-pack labeling improves correct end-of-life routing |
| Shelf Life (storage) | 12–24 months in dry, temperature-controlled storage away from UV and moisture | Accelerated aging / visual inspection | Exposure to humidity or sunlight shortens usable shelf life |
Related Products


Biodegradable Ice Cream Cups Ahead of the Curve From Concept to Delivery
Top Selling Products





- Related Blog
- Reviews
- Reviews
