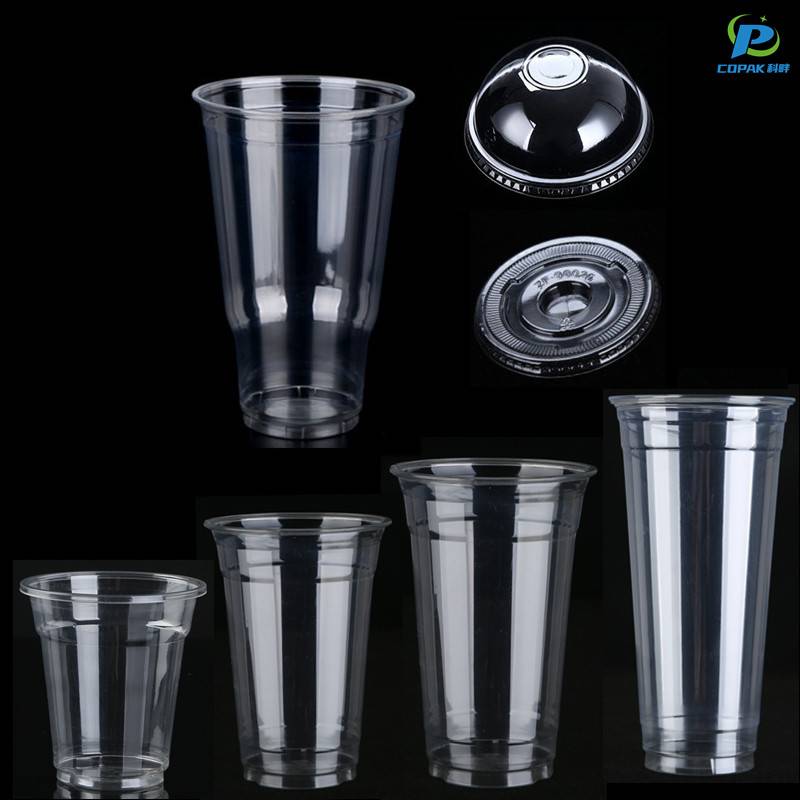
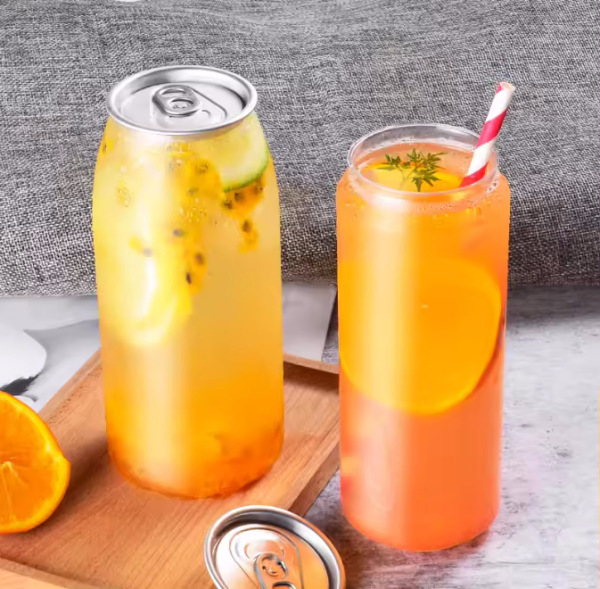
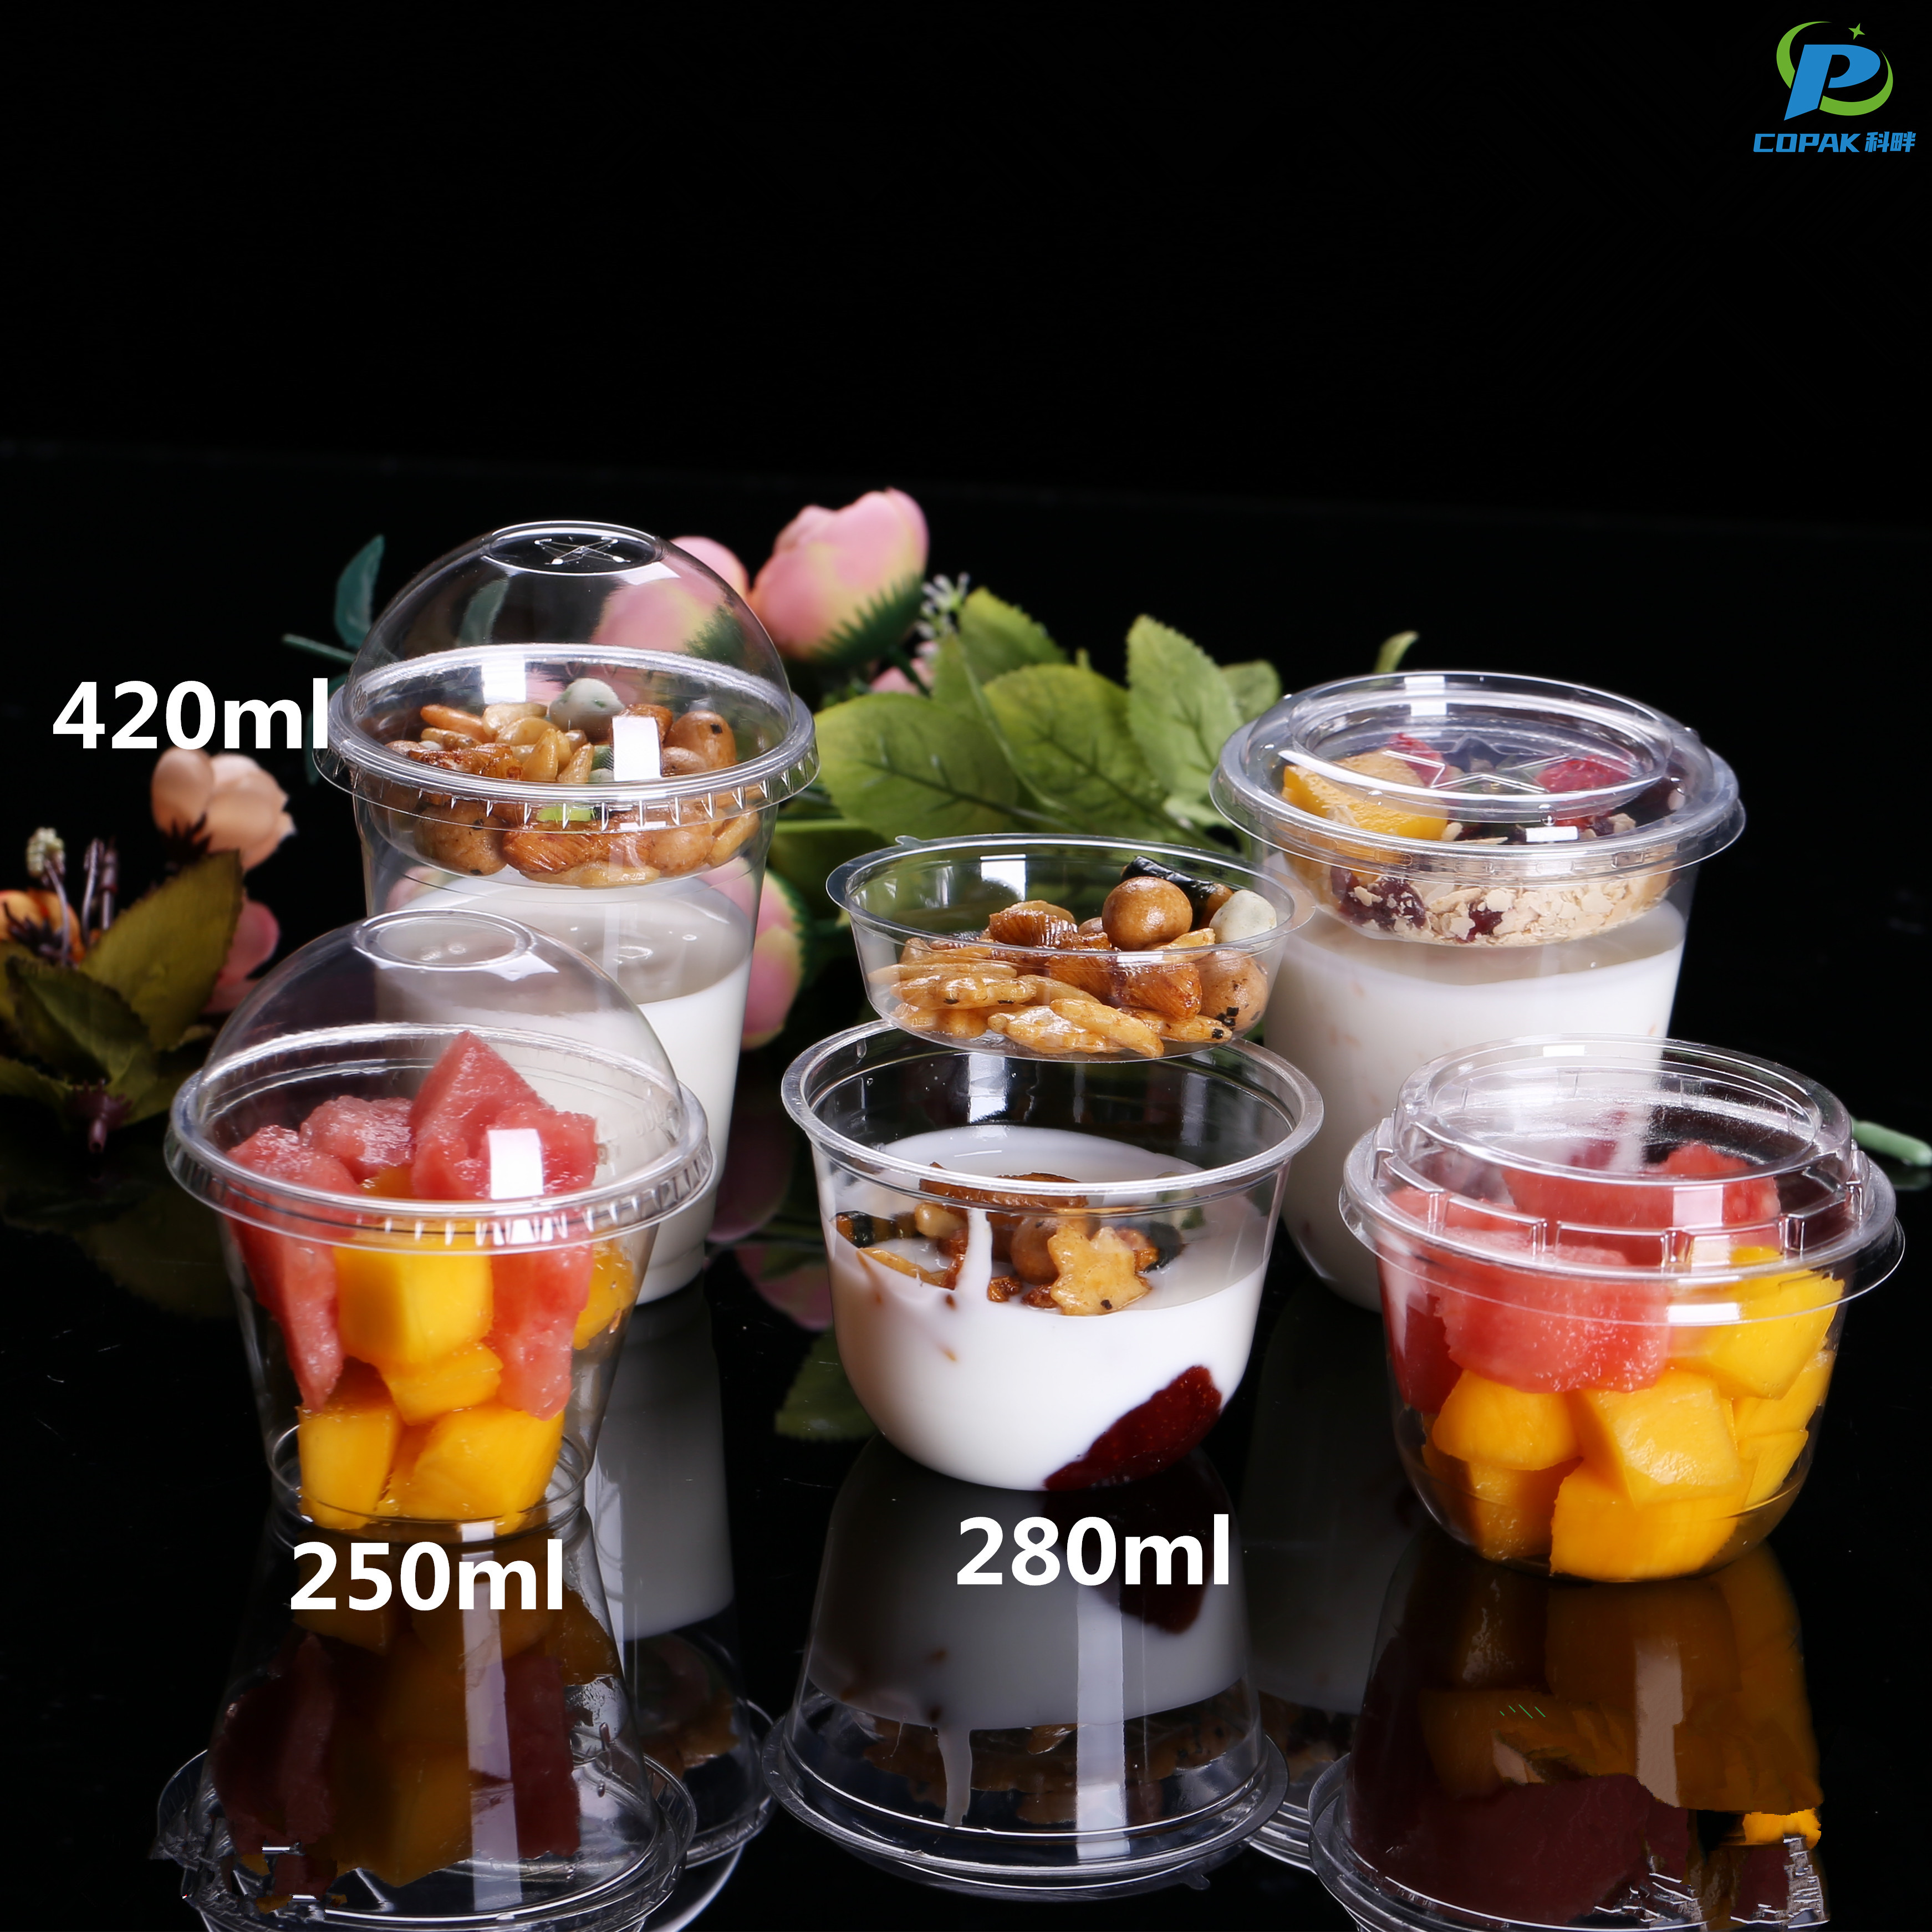
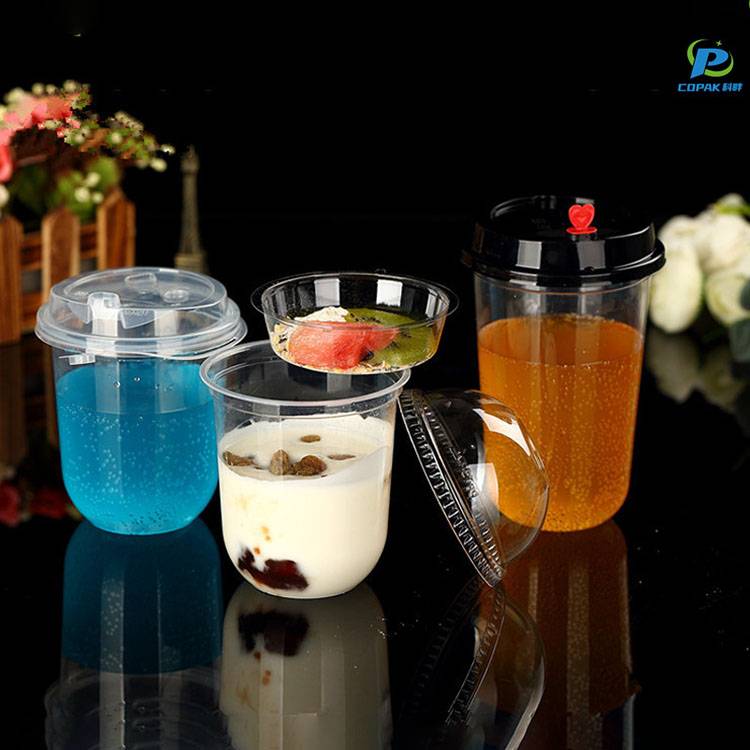
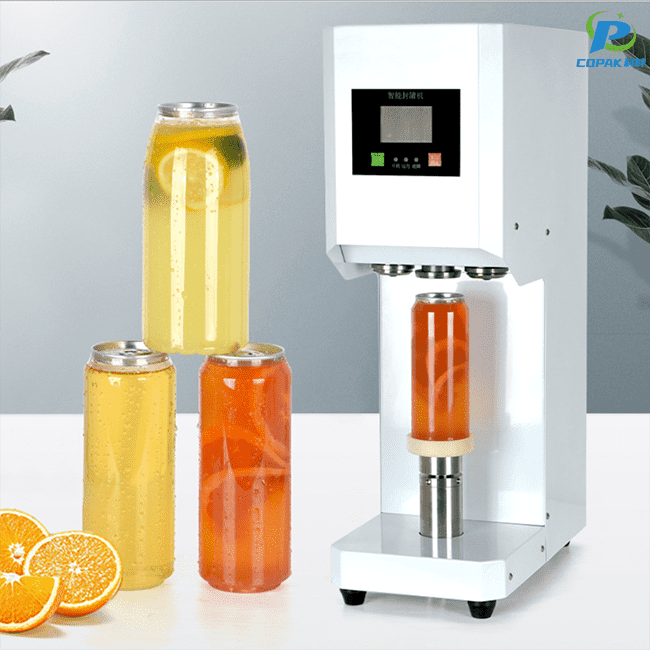
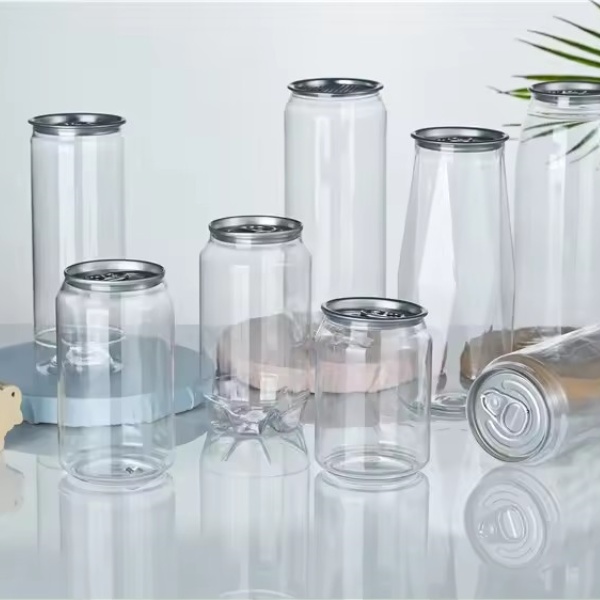
From a China-based Manufacturer, I’m offering a Clear PET Cup that combines clarity with reliability for serious buyers. I know what B2B purchasers need: uniform thickness, crystal transparency, and performance in cold beverages. The Clear PET Cup uses food-grade PET, is BPA-free, and fully recyclable, aligning with sustainability goals across your supply chain. It’s crystal-clear, stackable, and compatible with standard lids, ideal for cafes, retailers, and events. We provide customization: sizes, volumes, branding options, and packaging. Fast lead times and scalable production help you meet rising demand. Whether you’re ordering small samples or large runs, I can help you secure steady supplies from China. I work directly with distributors and manufacturers seeking dependable partner to ensure clear communication, on-time deliveries, and competitive pricing. Let’s discuss your project and how the Clear PET Cup can enhance your product line and margins.
Clear PET cups combine crystal clarity, exceptional strength and low weight to showcase beverages while resisting cracks and deformation. Their reliable sealing and barrier properties preserve carbonation and freshness for cold drinks, iced coffee and ready-to-drink lines. Smooth surfaces enable high-resolution printing and labeling, and stackable designs reduce transport costs while improving shelf presence. For global purchasers, these cups offer scalable customization, consistent quality control and compliance with international food-safety standards. Widely recyclable and energy-efficient to produce, they lower lifecycle costs and support circular packaging goals—delivering a sustainable, cost-effective solution that outperforms many alternatives in retail and foodservice applications.
| Property | Clear PET (typical) | Common Alternatives (PS / PLA / PP) | Notes |
|---|---|---|---|
| Material density (g/cm³) | 1.35 – 1.40 g/cm³ | PS: 1.04–1.06 / PLA: ~1.24 / PP: 0.90–0.92 | Density influences perceived stiffness and weight; PET feels substantial while remaining lightweight. |
| Visual clarity (light transmittance) | ~88% – 92% total light transmittance | PS: ~90%–94% / PLA: ~85%–90% / PP: ~75%–85% | Clear PET provides high gloss and excellent product visibility, beneficial for chilled beverages. |
| Tensile strength (yield, MPa) | ~55 – 75 MPa | PS: ~40–60 / PLA: ~50–70 / PP: ~30–40 | PET balances stiffness and strength, supporting thin-wall designs with good handling performance. |
| Flexural modulus (GPa) | ~2.5 – 3.5 GPa | PS: ~2.8–3.3 / PLA: ~2.7–3.2 / PP: ~1.2–1.8 | Higher modulus indicates a stiffer cup; PET and PS give a firmer feel than PP. |
| Impact resistance (typical) | Moderate — ductile under stress (notched Izod ~4–8 kJ/m², typical range) | PS: Low (brittle) ~1–3 / PLA: Low–Moderate ~2–6 / PP: High (very tough) | PET resists cracking better than PS/PLA in chilled-service applications; PP excels for drop resistance. |
| Thermal behavior (Tg / use temp) | Glass transition ~70–80°C; suitable for chilled and room-temperature use; limited high-heat exposure | PS Tg ~90–100°C (brittle when chilled) / PLA Tg ~55–65°C (softens) / PP usable to ~100–120°C | PET is not generally recommended for repeated high-temperature reheating; PP is preferred for hot-fill or microwaveable use. |
| Oxygen barrier (relative) | Good — relatively low OTR compared with many commodity plastics | PS: Moderate / PLA: Moderate / PP: Fair | PET's barrier supports shelf stability of oxygen-sensitive beverages better than many alternatives. |
| Water vapor barrier (relative) | Good — moderate WVTR, performs well for liquid retention and carbonation retention | PS: Moderate / PLA: Moderate–High / PP: Good | Barrier performance is formulation- and thickness-dependent; PET offers consistent performance for cups and lids. |
| Recyclability / end-of-life | Widely mechanically recyclable (resin code 1); established collection and recycling streams in many regions | PS: Limited recycling streams (code 6) / PLA: Industrial composting or specialized streams / PP: Recyclable but variable collection (code 5) | PET benefits from mature recycling infrastructure; design for recyclability (mono-material cups) improves recovery rates. |
| Cradle-to-gate carbon footprint (typical, kg CO2e/kg) | ~2.0 – 3.0 kg CO2e per kg of resin (production-dependent) | PS: ~2.5–3.5 / PLA: ~1.5–2.5 (variable, biobased contributions) / PP: ~1.7–2.5 | Lifecycle emissions vary by feedstock, production efficiency, and regional energy mix; recycling reduces overall footprint. |
| Manufacturing yield & forming | High yield in thermoforming and injection moulding; enables thin-wall, clear cups with consistent results | PS: High yield for thermoforming / PLA: Moderate yield, sensitive to processing conditions / PP: High yield but opaque unless specialized grades | PET supports high-speed cup production with good cosmetic finish and minimal rejects when processing is optimized. |
| Consumer preference (clarity & perceived quality, index 0–100) | ~82 (high preference for clarity and product visibility) | PS: ~78 / PLA: ~72 / PP: ~65 | Survey indices typically show clear PET preferred for chilled beverages due to bright appearance and perceived freshness. |