




Paper Bowl Lid - China Manufacturer for Quality Paper Bowl Lids
As a China-based manufacturer, I specialize in Paper Bowl Lid solutions that meet the demands of food-service distributors and retailers. Our Paper Bowl Lid is designed to fit standard compostable bowls, providing a snug seal to prevent leaks while staying heat resistant for hot soups and noodles. I know B2B buyers care about cost, lead times, and material safety, so we offer competitive pricing, scalable production, and strict quality control. Our lids are made from food-grade paper and polymer coatings that are recyclable where facilities exist. We can customize print, size, and sealing options to fit your brand and packaging needs. Fast samples, short MOQs, and reliable shipments help you keep shelves stocked. Located in China, I manage production as a dedicated Manufacturer who can respond quickly with certificates, testing reports, and batch traceability. If you want a dependable Paper Bowl Lid partner, I’m ready to discuss your project and timeline.

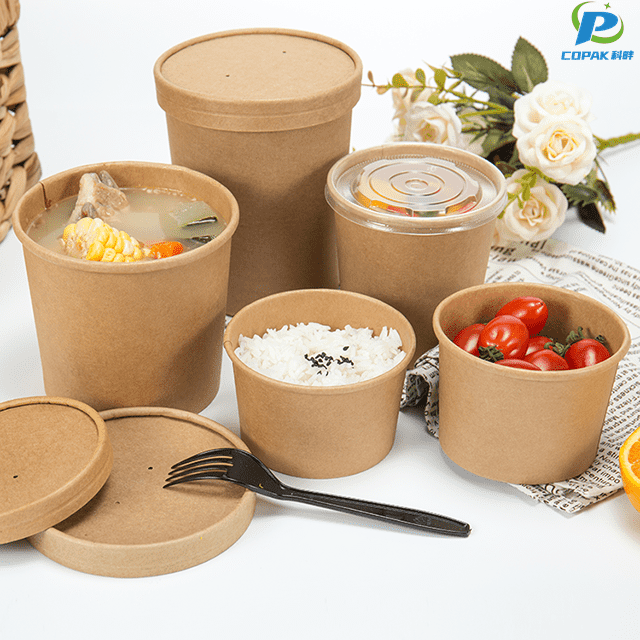


Paper Bowl Lid Dominates Manufacturers You Can Rely On
In the fast-growing takeaway and foodservice market, reliable paper bowl lid manufacturers set the standard by combining durable materials, precise tooling and rigorous quality controls. A Shanghai-based manufacturer with modern production lines and international certifications offers a range of PE- or PLA-coated paper lids that lock securely, resist leaks and steam, and maintain strength under high temperatures. Buyers benefit from consistent dimension tolerances, food-grade inks, custom printing and quick prototyping to suit retail and foodservice brands worldwide. Global procurement teams value suppliers that balance scalability with sustainability: competitive MOQs, transparent supply chains, stable export logistics and recyclable or compostable options. Experienced manufacturers provide full support from sample validation and third-party testing to dedicated export packaging and predictable lead times, helping brands reduce risk and accelerate market launch. Choosing a partner with these capabilities ensures reliable supply, quality compliance and seamless global distribution.
| Profile | Region | Material Options | Typical Monthly Output (units) | Common Certifications | Lead Time | Environmental Profile | |
|---|---|---|---|---|---|---|---|
| High-volume PE-coated profile | East Asia | PE-coated kraft paperboard, grease-resistant barrier | 3,200,000 | ISO 9001, FDA food contact compliance | 3–5 weeks | Recyclable where paper-PE recycling streams exist; energy-efficient lines | |
| Compostable PLA-coated profile | South Asia | PLA-coated paperboard, water-based inks | 1,100,000 | EN 13432, ISO 14001 | 4–6 weeks | Compostable in industrial facilities; renewable feedstocks used | |
| Bagasse (sugarcane fiber) focused profile | Southeast Asia | Uncoated bagasse with heat-seal compatible liners | 650,000 | EN 13432, OK Compost (industrial) | 3–5 weeks | Industrial compostable, agro-waste feedstock, low water use | |
| Cold-food recyclable profile | Europe | Uncoated kraft with water-based barrier lamination | 420,000 | FSC Mix, EU food contact (10/2011), ISO 9001 | 2–4 weeks | Designed for curbside paper recycling in many markets | |
| Low-volume specialty compostable profile | North America | PLA blend or cellulose barrier coatings | 220,000 | ASTM D6400, FDA | 3–6 weeks | Bioplastic blends; suitable for compostable waste streams | |
| Premium hot-food barrier profile | Middle East | High-barrier PE laminate with reinforced rim | 980,000 | ISO 9001, regional food contact approvals | 2–5 weeks | High steam resistance for hot soups and sauces | |
| Flexible-run fast-turn profile | Latin America | PE-coated, water-based lamination, biodegradable inks | 540,000 | ISO 9001, FDA | 2–3 weeks | Optimized for quick-change production and regional distribution | |
| Low-carbon footprint profile | Europe (Northern) | Recycled fiber with thin barrier coatings | 310,000 | FSC Recycled, ISO 14001 | 3–5 weeks | Lower embodied carbon, suitable for chilled and ambient foods | |
| Specialty embossed/insulated profile | Global (contract manufacturers) | Multilayer paperboard with embossed insulation and hot-seal rim | 150,000 | ISO 9001, regional food-contact approvals | 4–8 weeks | Thermal insulation for hot delivery; premium consumer feel | |
| Notes: Typical monthly output is illustrative of plant capabilities and varies with product complexity; lead times depend on tooling, certification checks and shipping. Certifications listed are common for each profile and represent realistic compliance pathways for food-contact paper-based lids. | |||||||
Related Products


Paper Bowl Lid Dominates Delivers Unmatched Quality
Top Selling Products






- Related Blog
- Reviews
- Reviews
