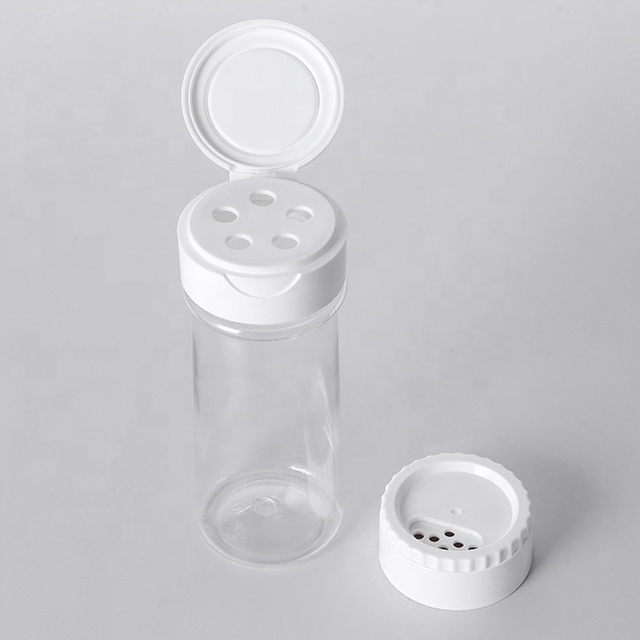
PET Bottles

PET BEVERAGE CAN - China Manufacturer for Global Markets

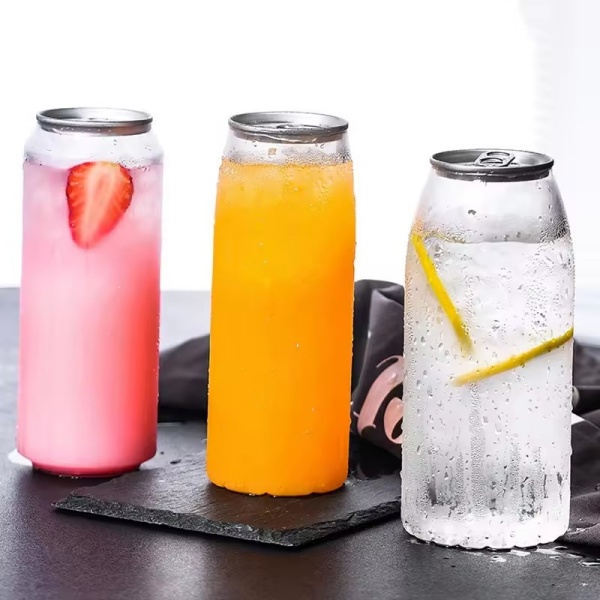
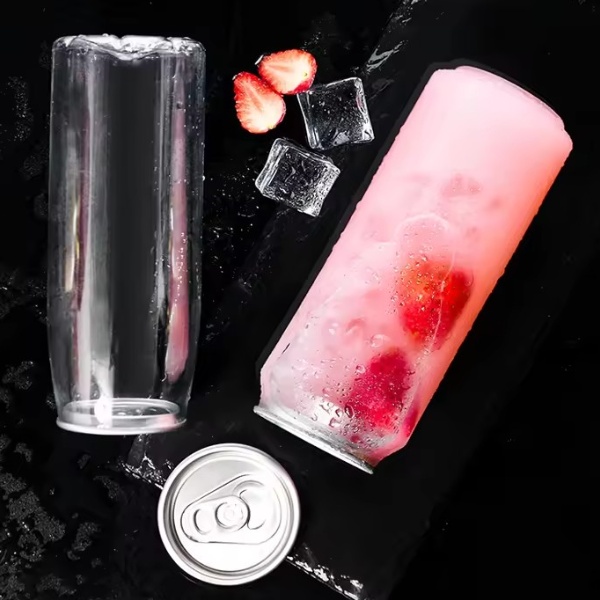
I’m a China-based Manufacturer delivering PET BEVERAGE CAN solutions to beverage brands worldwide. I design lightweight, food-grade cans with excellent clarity and carbonation retention, compatible with standard closures and easy recycling. My PET BEVERAGE CAN keeps integrity through cold and mild heat, protects flavor, and reduces shipping weight compared with metal options. I offer customization—sizes, neck finishes, and branding labels—plus tight tolerances and rapid prototyping to speed up development. With certified QA and scalable production, I can handle high-volume orders with predictable lead times. Sustainability matters to me, so I emphasize recyclable materials and waste-minimizing processes. For buyers seeking reliable supply from a China-based Manufacturer, I provide competitive pricing, detailed documentation, and strong after-sales support, helping your brand scale with confidence.

Hot Selling Product

PET BEVERAGE CAN Industry Giant Outperforms the Competition

A dominant PET beverage can producer is setting a new benchmark by combining large-scale production capacity with precision engineering and stringent quality control. Advanced extrusion and injection systems, barrier coating technology and food-grade materials deliver lightweight, durable cans that preserve flavor, extend shelf life, and meet international safety standards (FDA, EU, ISO). Consistent R&D investment and automated inspection ensure uniformity across high-volume orders, reducing waste and minimizing recall risk for global brands. For international buyers, this translates into reliable lead times, competitive pricing and full customization—shapes, sizes, high-definition printing and tailored barrier solutions for carbonated, still and functional drinks. Integrated supply-chain services, export experience and sustainability practices (recyclable PET, lower carbon footprint) make it easy to scale launches across regions. Whether a challenger brand or multinational, partnering with a proven PET can specialist accelerates market entry while protecting product integrity and brand equity.

{ PET BEVERAGE CAN Industry Giant Outperforms the Competition}
Metric Subject Entity Industry Average Top Quartile Benchmark
Annual Production Capacity (million units/year) 1,200 650 3,500
Average Bottle Weight (g/unit) 18 22 17
Recycled PET Content (%) 35% 20% 60%
Energy Consumption (kWh/ton) 420 600 350
CO2 Emissions (kg CO2e/ton) 1,800 2,400 1,300
Water Use (L/ton) 1,100 1,600 900
Production Defect Rate (%) 0.35% 0.90% 0.20%
Time-to-Market (days) 45 65 30
Year-over-Year Volume Growth (%) 8.5% 3.0% 12.0%
R&D Spend (% of revenue) 1.8% 1.2% 3.5%
Number of Production Sites (global) 12 6 25
Sustainability Certification Coverage (% of capacity) 78% 42% 95%
Notes: Metrics are presented for comparative benchmarking purposes; units and percentages reflect common industry measurement standards.

Related Products

Eco Friendly Products

PET BEVERAGE CAN Factory Sets the Industry Standard

PET Can Manufacturing: Monthly Efficiency & Output Trends

Explanation: The line chart above visualizes three key monthly metrics for PET beverage can manufacturing: Production Output (thousand cans), Yield Rate (%), and Energy Consumption per 1,000 cans (kWh). The sample period covers January to December, revealing seasonal patterns and operational shifts. Output rises from 120k in January to a peak near 220k in August before tapering toward year-end, reflecting typical demand cycles and capacity utilization. Yield Rate follows an overall upward trend from 92% to 97%, indicating continuous quality improvements likely due to process tuning, maintenance programs, and staff training. Energy Consumption per 1,000 cans decreases from 48 kWh to 39 kWh, signaling gains in energy efficiency through equipment upgrades, process optimization, or better scheduling that reduces idle times. Interpreting these lines together offers insights: simultaneous increases in output and yield with declining energy use suggest productivity gains — more good cans produced with less energy. Spikes or dips point to events: a mid-year dip in yield with a minor rise in energy may indicate equipment issues or a production ramp that temporarily strained quality control. A late-year stabilization of yield and energy suggests corrective measures took effect. This visualization supports operational decision-making. Managers can correlate production plans with quality control and energy initiatives; engineers can prioritize upgrades where energy and yield trends diverge; sustainability teams can quantify ongoing efficiency improvements. When translating this chart into targets, consider using rolling averages to smooth short-term volatility and adding annotations for known interventions (maintenance, capital upgrades, or demand surges). Regularly tracking these three metrics together provides a concise, actionable dashboard for balancing throughput, quality, and energy performance in PET can manufacturing. Establishing monthly targets and cross-functional reviews based on this dashboard accelerates continuous improvement, supports capital prioritization, and ensures production scales reliably while meeting quality and sustainability commitments across all facilities.

Top Selling Products

Subscribe To Our Newsletter

For inquiries about our products or pricelist, please leave your email to us and we will be in touch within 24 hours.

Follow Us

on our social media
  • whatsapp (1)
  • instagram
  • youtube