PET Bottles

Plastic Beverage Bottles Manufacturer in China - Reliable Supplier

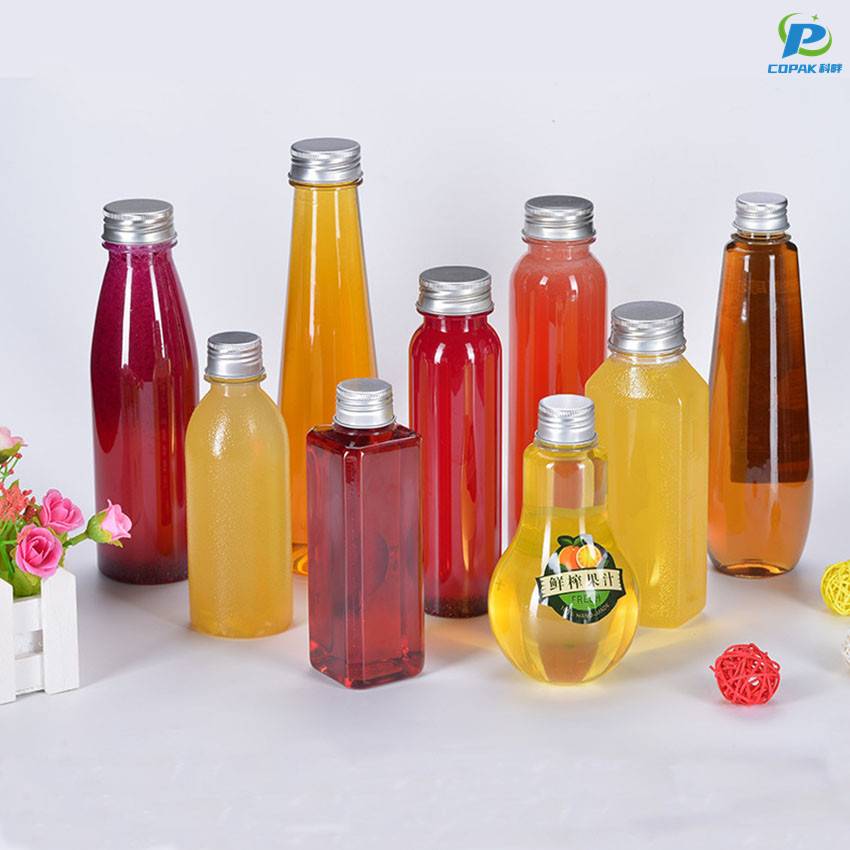
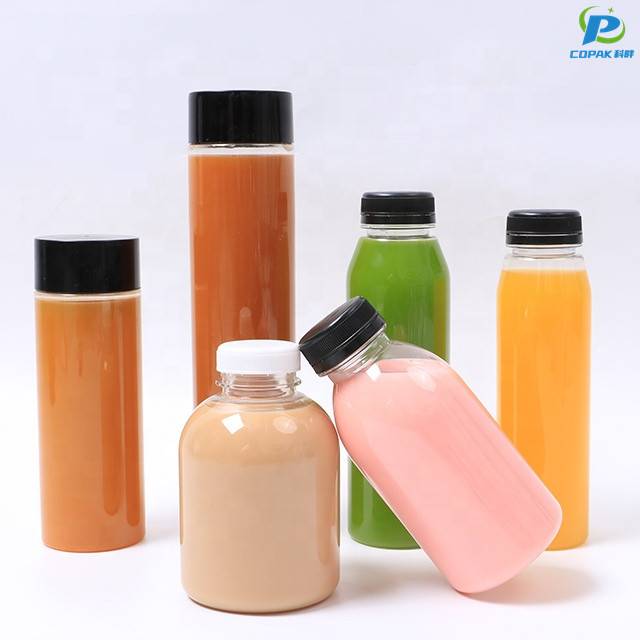
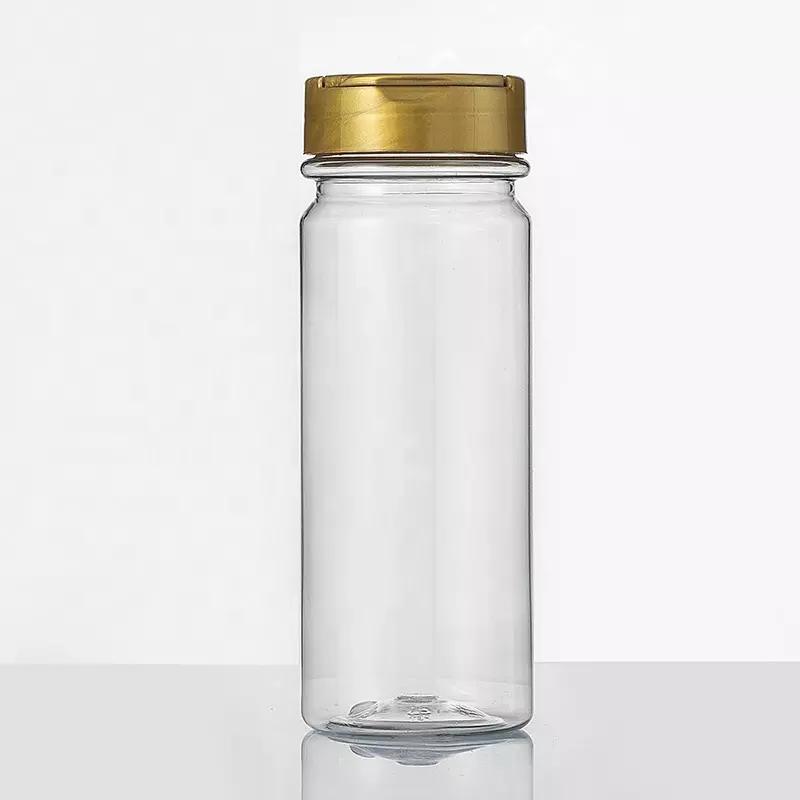
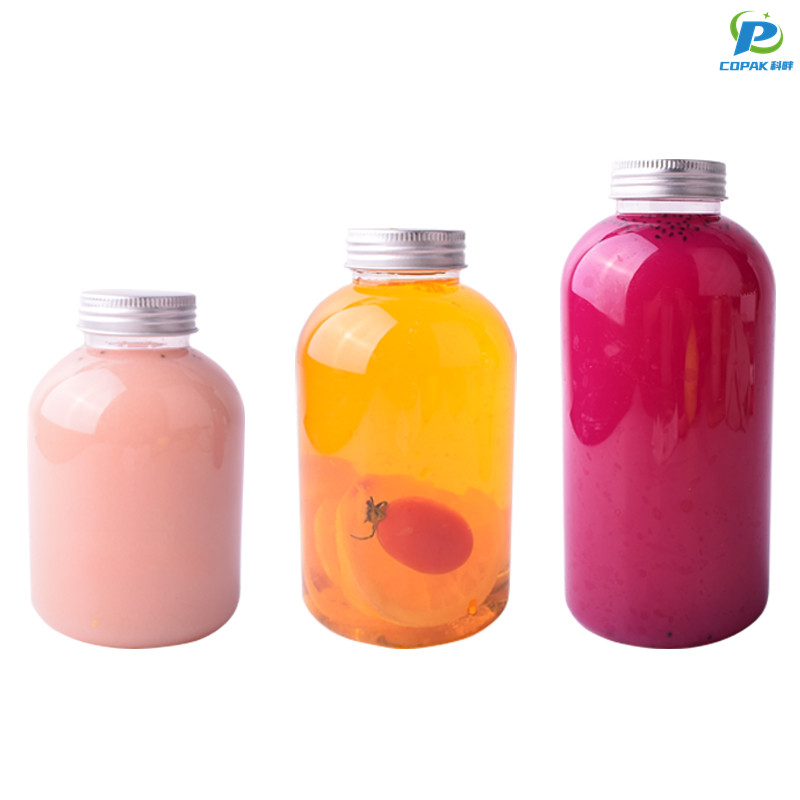
I am a China-based manufacturer of Plastic Beverage Bottles, here to support your brand with reliable, cost-effective packaging. Our bottles are made from PET, light yet strong, with tight caps and smooth finishing that reduce leak risks and impress customers. I can supply standard sizes and custom colors, neck finishes, and printing options to match your label design. Lead times are short, and MOQs are friendly for growth. We use GMP-compliant processes and rigorous quality checks, so your shipments arrive ready to fill. For food-contact safety, our bottles comply with local and international standards, giving you peace of mind in global markets. If you search for a dependable supplier in China, I am ready to discuss volumes, temperatures, and shelf life. Let me help your line scale with consistent supply, competitive pricing, and proven performance. Plastic Beverage Bottles for brands that deserve nothing less.

Hot Selling Product

Plastic Beverage Bottles Industry Giant For the Current Year

As the global beverage market demands higher standards of safety, sustainability and supply reliability, a Shanghai-based manufacturer has emerged as an industry giant this year by combining advanced stretch-blow and injection molding technologies with rigorous food-grade quality systems. Offering a broad portfolio of PET and HDPE bottles for water, soft drinks, juices, dairy and specialty beverages, the factory supports lightweight designs, hot-fill and barrier options, full decoration (labeling, shrink-sleeve, screen-printing) and tailored neck finishes to meet diverse brand requirements while complying with international FDA and EU regulations. For global buyers seeking stable, scalable partners, this supplier emphasizes consistent on-time deliveries, competitive pricing through optimized production lines, flexible MOQs for private-label projects and robust QC including IQC/IPQC/OQC and third-party testing. Sustainability initiatives such as rPET integration, material reduction and recyclable designs reduce carbon footprint without compromising performance. Whether launching a new SKU or scaling seasonal volume, international procurement teams will find a seasoned OEM/ODM partner able to support sampling, factory audits and end-to-end export logistics for long-term collaboration.

{ Plastic Beverage Bottles Industry Giant For the Current Year}
Metric Unit Current Year Value YoY Change Notes
Estimated global beverage bottle production (units) billion units 480 +2.0% Industry production estimate for the current year (aggregate, beverage-focused)
Estimated annual mass of beverage bottles million tonnes 7.2 +1.8% Computed as production × average bottle weight (global average)
Average bottle weight grams 15 -3.0% Reflects ongoing lightweighting trends across bottle formats
Material distribution — PET % share 85% +0.5% PET remains the dominant material for beverage bottles
Material distribution — HDPE % share 8% -0.2% Used mainly for certain dairy and large-format bottles
Material distribution — Others (glass, mixed plastics) % share 7% -0.3% Includes glass, multilayer, and other polymers
Global recycling rate for beverage PET bottles % 30% +1.5% Global average; significant regional variation
Regional recycling rate — Europe % 60% +2.0% High collection and deposit-return systems drive rates
Regional recycling rate — North America % 29% +1.0% Collection infrastructure improving but variable by state/province
Regional recycling rate — Asia (major markets avg) % 25% +1.2% Wide variation between advanced and developing markets
Average recycled content in new bottles % rPET 25% +3.0% Post-consumer recycled PET share in new bottles (global average)
Estimated cradle-to-gate CO2e kg CO2e / kg PET 2.0 -0.5% Average lifecycle emissions estimate for virgin PET (cradle-to-gate)
Estimated CO2e per 500ml bottle g CO2e / bottle 30 -2.0% Approximation based on 15 g bottle weight and cradle-to-gate CO2e
Industry average R&D & sustainability investment % of revenue 0.8% +0.1% Estimated sector average focusing on lightweighting & recycling tech
Number of major manufacturing sites (global, estimated) sites 3,500 +0.5% Estimated count of medium-large production facilities focused on beverage bottles

Related Products

Eco Friendly Products

Plastic Beverage Bottles Application From Concept to Delivery

Per-Bottle Emissions and Cumulative Cost Across Production Stages

This line chart presents a stage-by-stage view of two complementary metrics for a typical plastic beverage bottle: CO2 emissions per bottle (grams) and cumulative cost per bottle (USD). The horizontal axis lists seven production and lifecycle stages from Concept through End-of-Life. The blue line shows direct emissions attributable to each stage: emissions peak during Material Sourcing (driven by resin production) and are also notable during Distribution & Retail due to transportation and cold-chain energy. The downward dip at End-of-Life represents net avoided emissions when recycling displaces virgin resin production. The orange line is a cumulative cost profile that accrues incremental expenses as the bottle moves from design into material acquisition, manufacturing, filling, and distribution; a slight reduction at End-of-Life models net recovery value from recycling or resale programs. Dual axes are used so that emissions (left axis, grams CO2) and costs (right axis, USD) remain readable without scaling distortion. This visualization supports decision-making by highlighting where interventions yield the highest impact per bottle: for example, targeting resin sourcing and transportation reduces the largest emissions slices, while manufacturing and distribution optimization most directly affect per-bottle cost. Users should note underlying assumptions: data are illustrative averages and do not reflect regional variances, material blends, or differing collection rates for recycling. Sensitivity analysis would be useful to test effects of increased recycled content, improved logistics efficiency, or extended producer responsibility schemes. Overall, the chart provides a concise map from concept to delivery that helps prioritize hotspots for emissions reduction and cost savings in beverage bottle lifecycles.

Top Selling Products

Subscribe To Our Newsletter

For inquiries about our products or pricelist, please leave your email to us and we will be in touch within 24 hours.

Follow Us

on our social media
  • whatsapp (1)
  • instagram
  • youtube