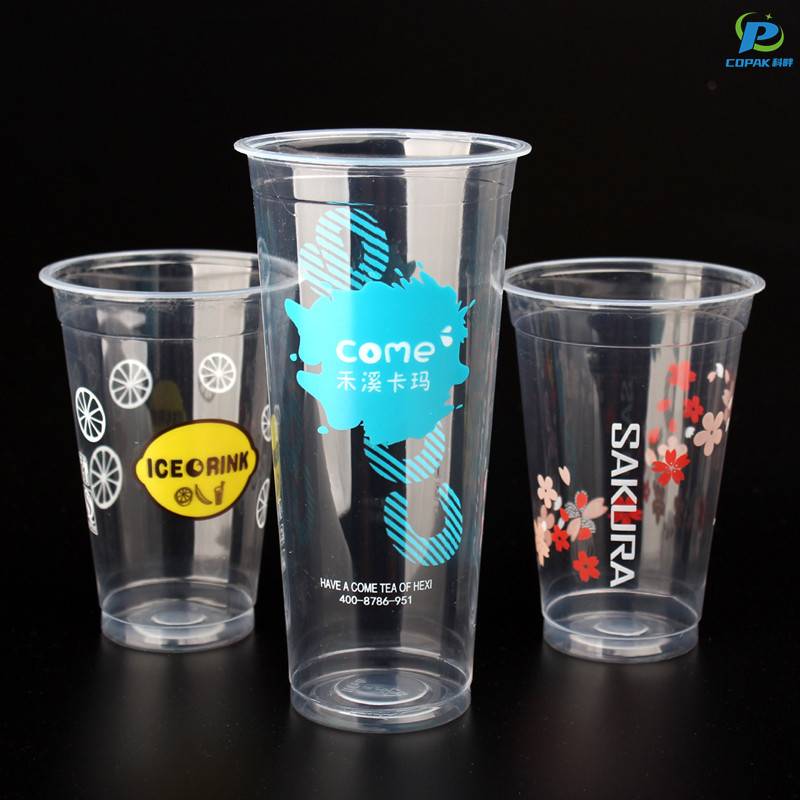
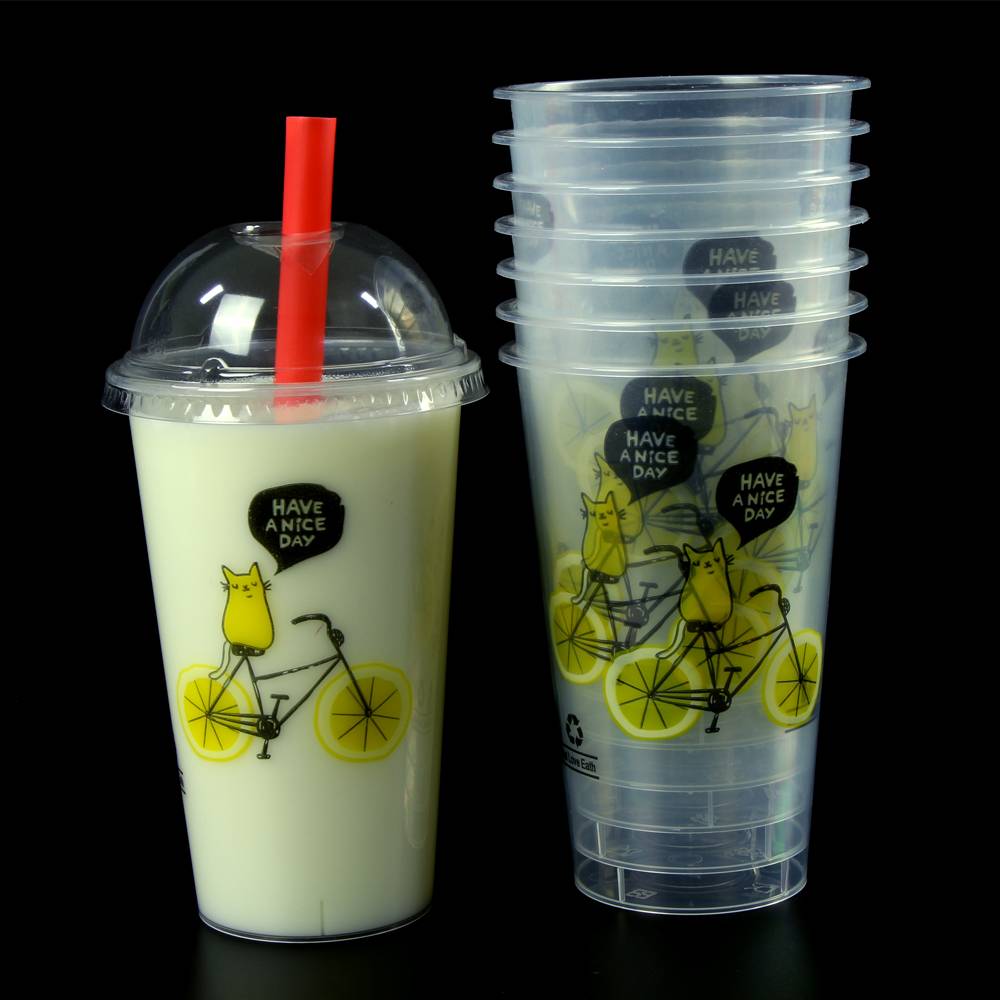
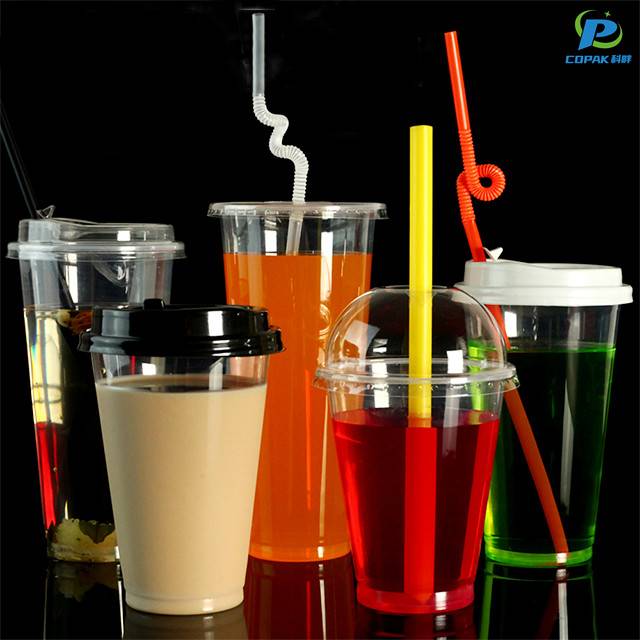
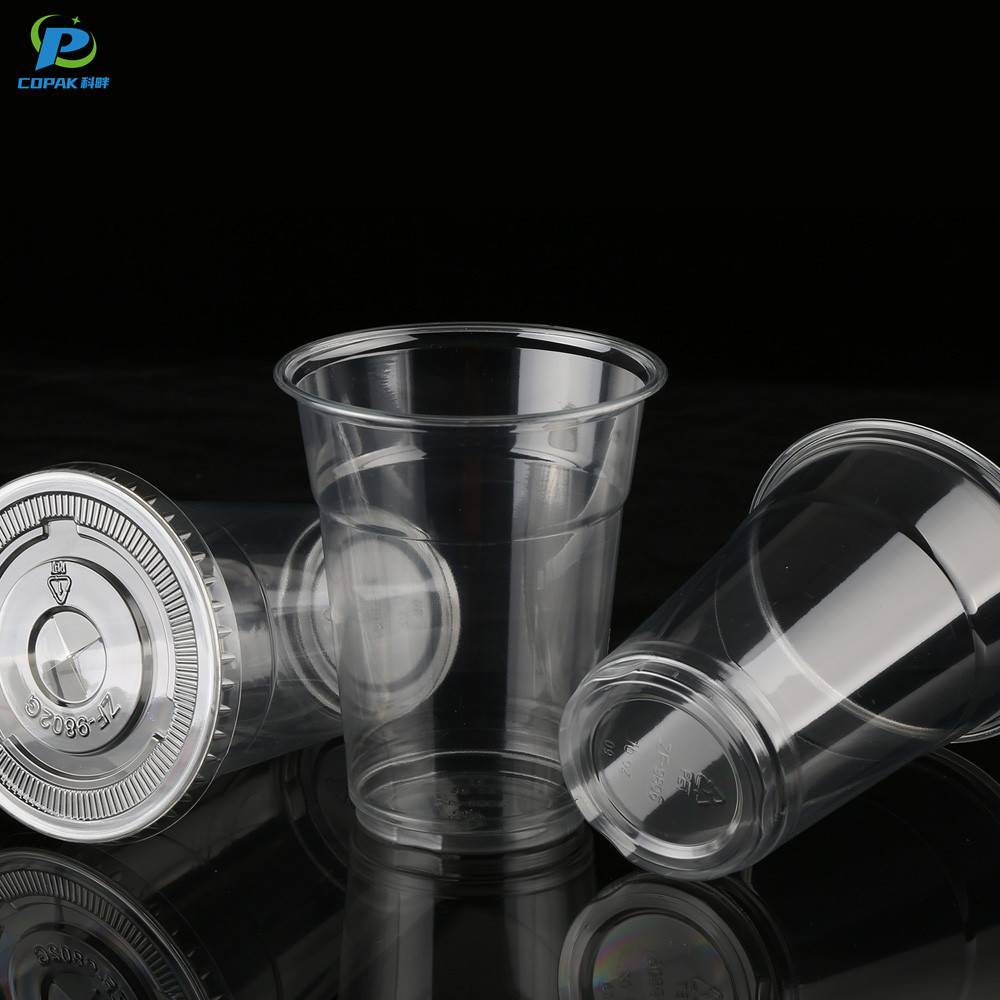
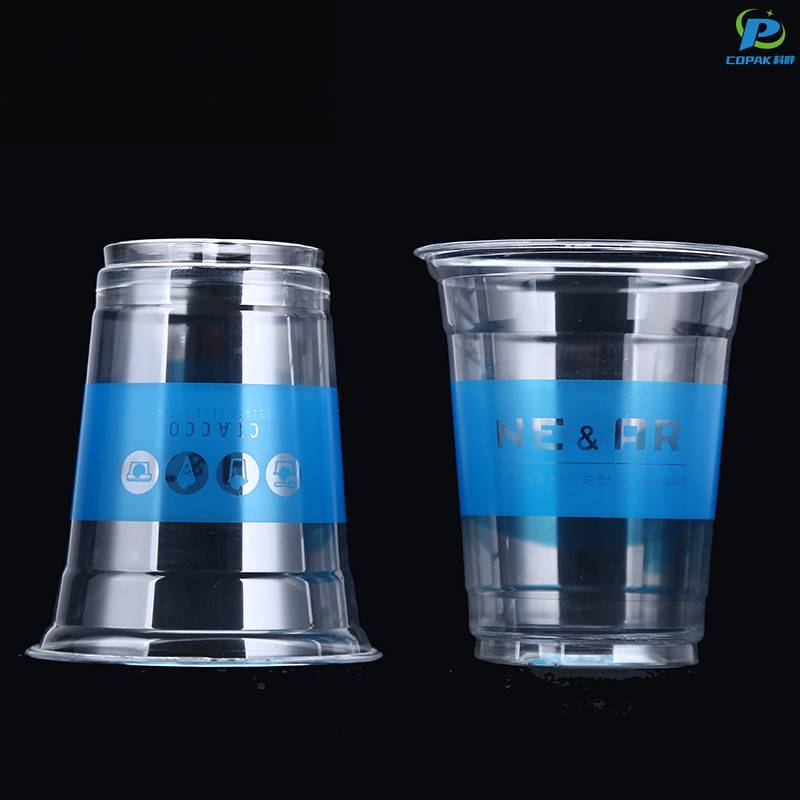
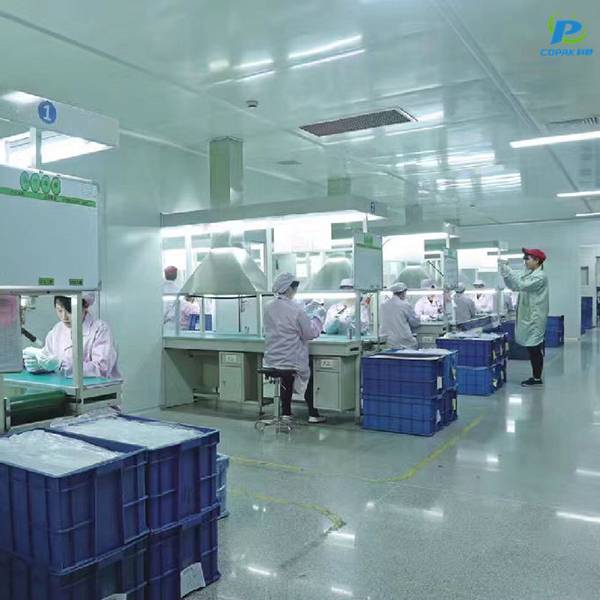
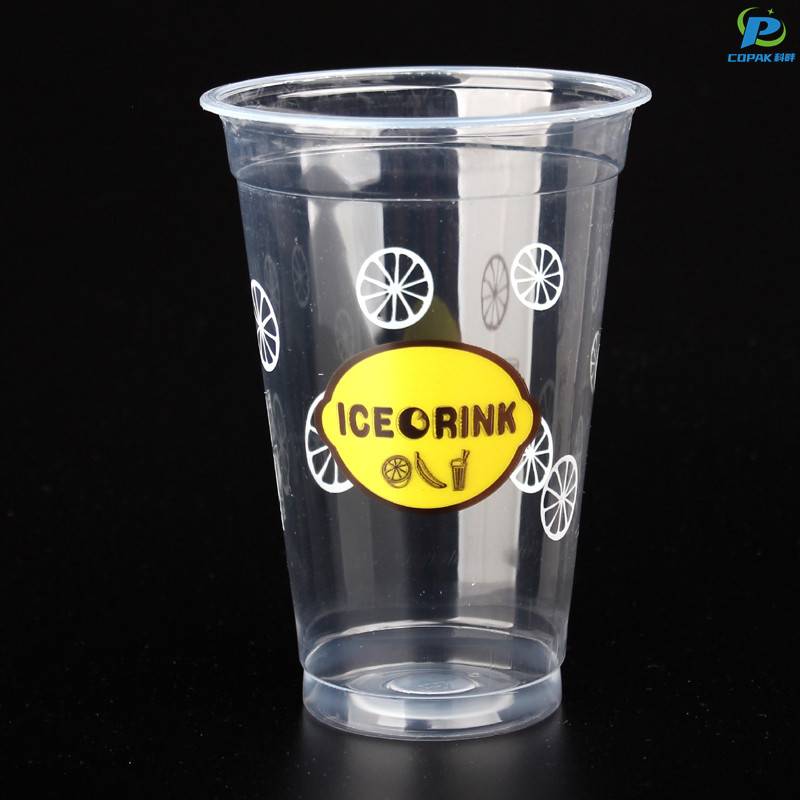
As a China Manufacturer, I offer Plastic Cups For Milkshake that hold up to thick blends and icy temps without leaks. For B2B buyers in China and abroad, these cups come in 12 oz, 16 oz, and 20 oz sizes, with crystal-clear clarity and smooth rims that feel premium. We supply FDA-compliant, BPA-free materials and can add logo embossing or printed designs to boost brand visibility. My team focuses on fast lead times, consistent bagging or box packaging, and flexible MOQ to fit pilot programs or full-scale rollouts. If you’re sourcing from China, you’ll appreciate our transparent pricing, proactive communication, and rigorous QA checks. I’m proud to be a dependable partner for cafes, bakeries, and beverage chains seeking reliable Plastic Cups For Milkshake with strong endurance in busy service. Let’s align on specs, timing, and shipping so your shelves stay stocked.
Milkshake pioneers winning in 2025 choose plastic cups that combine form and function: crystal-clear clarity to showcase product, robust wall strength for thick textures, tight lid and straw compatibility for delivery, and stackable designs for efficient service. Options in recyclable PP or bio-based PLA meet rising sustainability demands while maintaining cold resistance and food-safety compliance (FDA/EU standards). Custom printing, color choices, and embossing turn packaging into a branding tool that boosts impulse sales. For global buyers, scalability and reliability matter: flexible MOQs, fast prototyping, strict QC, optimized packing for lower freight costs, and compliant material sourcing ensure timely launches and consistent quality across markets. By prioritizing performance, customization, and sustainable options, suppliers and retailers can capture market share in the booming shake and on-the-go beverage sector in 2025.
| Cup Variant | Typical Capacity (oz / ml) |
Avg Weight (g) |
Material | Compostability | Recyclability (% est.) |
CO2e per cup (g CO2e) |
Thermal Insulation (1-5) |
Leak Resistance (1-5) |
Field Adoption (% in 2025) |
Notes |
|---|---|---|---|---|---|---|---|---|---|---|
| Clear Rigid PP Cup (12 oz) | 12 / 355 | 8 | Polypropylene (PP) | No | 65 | 50 | 2 | 4 | 42 | Stiffness and clarity ideal for cold milkshakes; commonly accepted in PP streams. |
| Clear Rigid PP Cup (16 oz) | 16 / 473 | 10 | Polypropylene (PP) | No | 65 | 60 | 2 | 4 | 48 | Popular larger size; balance of material use and mechanical strength for scooped shakes. |
| High-Barrier PET Cup (16 oz) | 16 / 473 | 9 | PET with barrier coating | No | 55 | 65 | 2 | 3 | 18 | Barrier improves shelf/moisture control but reduces recycling acceptance in many streams. |
| PLA Industrial-Compostable Cup (12 oz) | 12 / 355 | 9 | Polylactic acid (PLA) | Industrial | 5 | 75 | 3 | 3 | 22 | Requires industrial composting; limited curbside recycling value; growing in pilot programs. |
| Paper Cup with Bioplastic Lining (16 oz) | 16 / 473 | 12 | Paper + PLA lining | Industrial | 10 | 85 | 4 | 4 | 28 | Better thermal feel; compostability depends on local processing; commonly used for premium shakes. |
| Double-Wall Insulated Paper Cup (12 oz) | 12 / 355 | 14 | Paper double-wall | Industrial | 15 | 95 | 5 | 4 | 12 | Excellent insulation for texture-sensitive milkshakes; heavier material footprint. |
| High-RPCR (Recycled PP) Cup (16 oz) | 16 / 473 | 11 | Recycled polypropylene (rPP) | No | 70 | 45 | 2 | 4 | 35 | Lower carbon footprint due to recycled content; strong circularity potential where collection exists. |